
Version 26.2.a
New functionality
Detection triage & investigation using Agentic AI
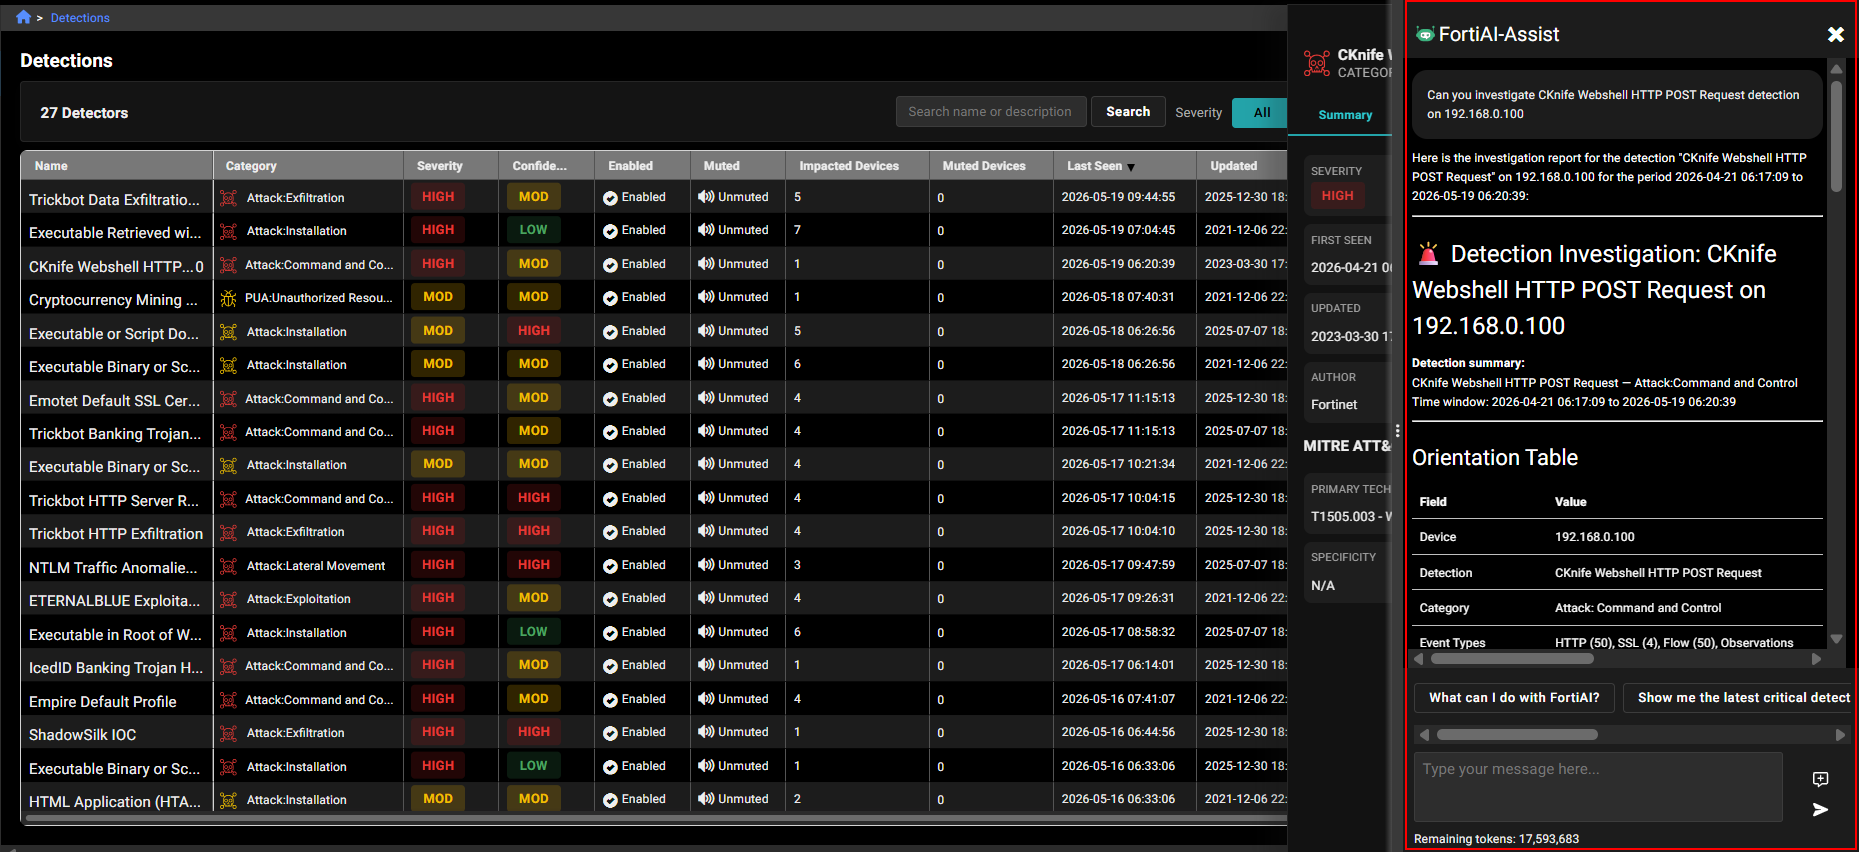
FortiAI‑Assist for FortiNDR Cloud has been enhanced with agentic capabilities. Security analysts can now use FortiAI‑Assist to triage and investigate detections. The detection triage agent analyzes relevant network telemetry and provides a summary of findings, risk assessment, and recommended next steps based on detected activity.
For example: Can you investigate CKnife Webshell HTTP POST Request detection on 192.168.0.100?
FortiAI‑Assist supports conversations in more than 50 languages, including major languages such as English, Spanish, French, German, Mandarin Chinese, Arabic, Japanese, Hindi, and Portuguese.
Users can also generate entity reports and ask questions related to threat coverage.
Data masking has been extended to include MAC addresses in addition to IP addresses.
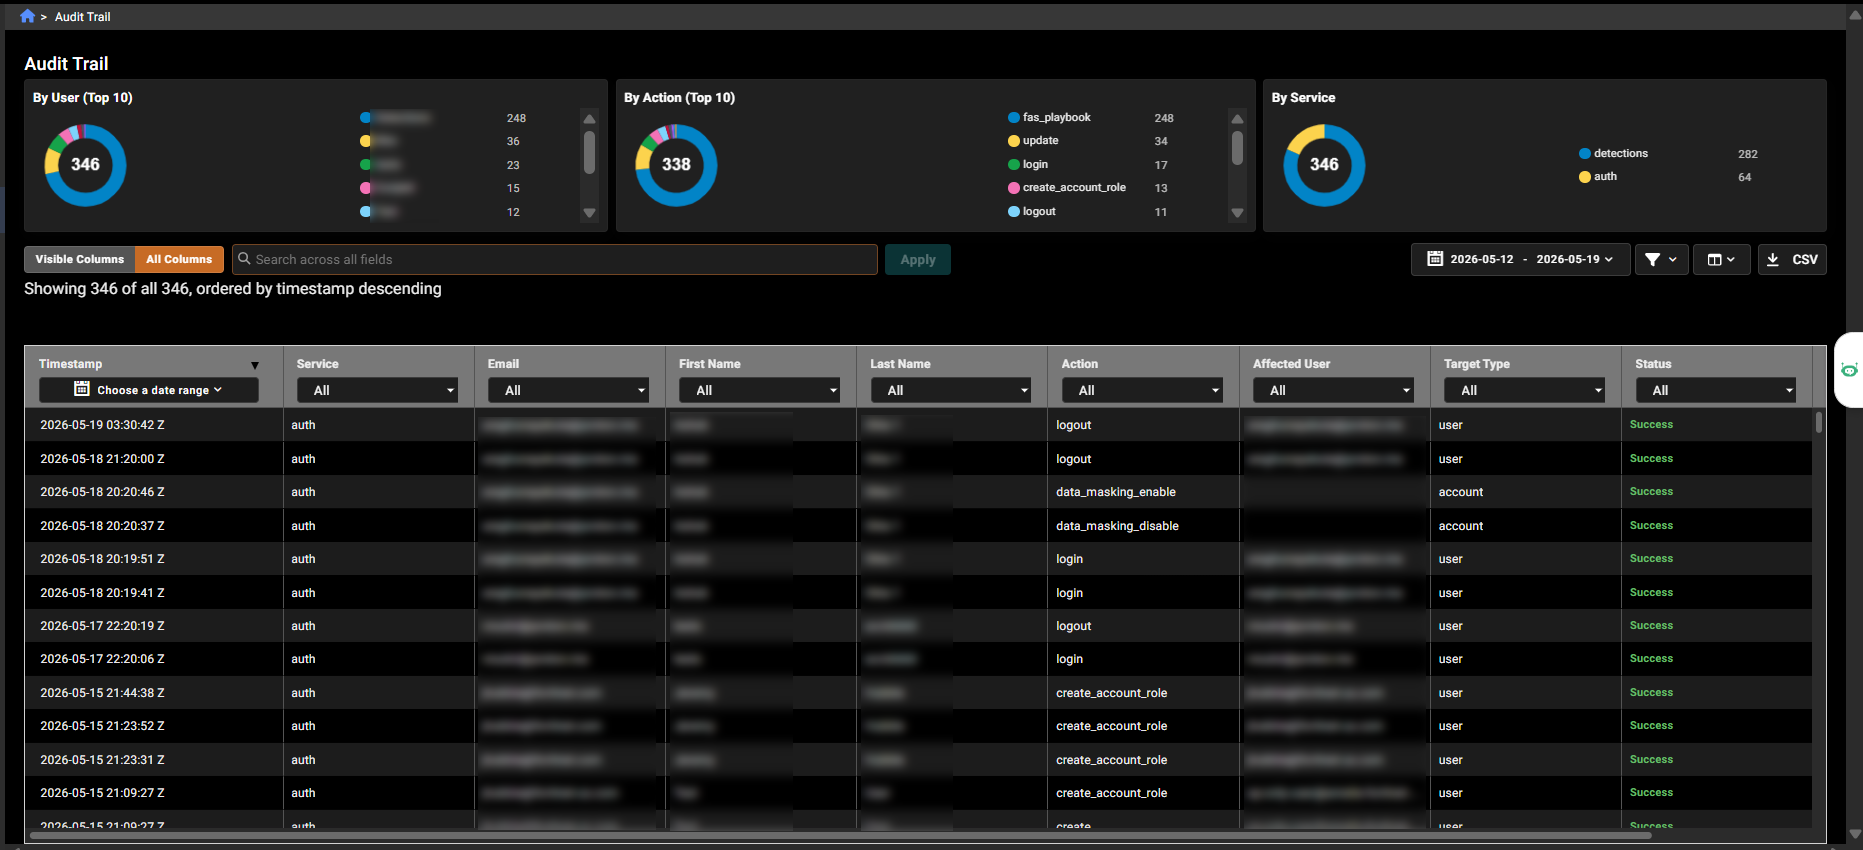
Audit trail page for Compliance and Monitoring
The Audit Trail page provides visibility into system events already captured by FortiNDR Cloud. It enables tracking of configuration changes, including what was changed and by whom, supporting compliance and monitoring use cases. Captured events include user authentication activity (login, logout, password changes and resets, MFA enable and disable), user management actions (create, update, delete, disable, role assignment, and token management), and automated detection and response activity such as playbook execution, AutoIR configuration updates, and endpoint isolation actions. This page is available to users with Admin permissions.
To access the page, go to Settings > Audit Trail.
The charts at the top of the page show activity by user, action, and service over a selected time range. Admins can filter and search records, review event details, and investigate system activity for auditing or troubleshooting purposes.
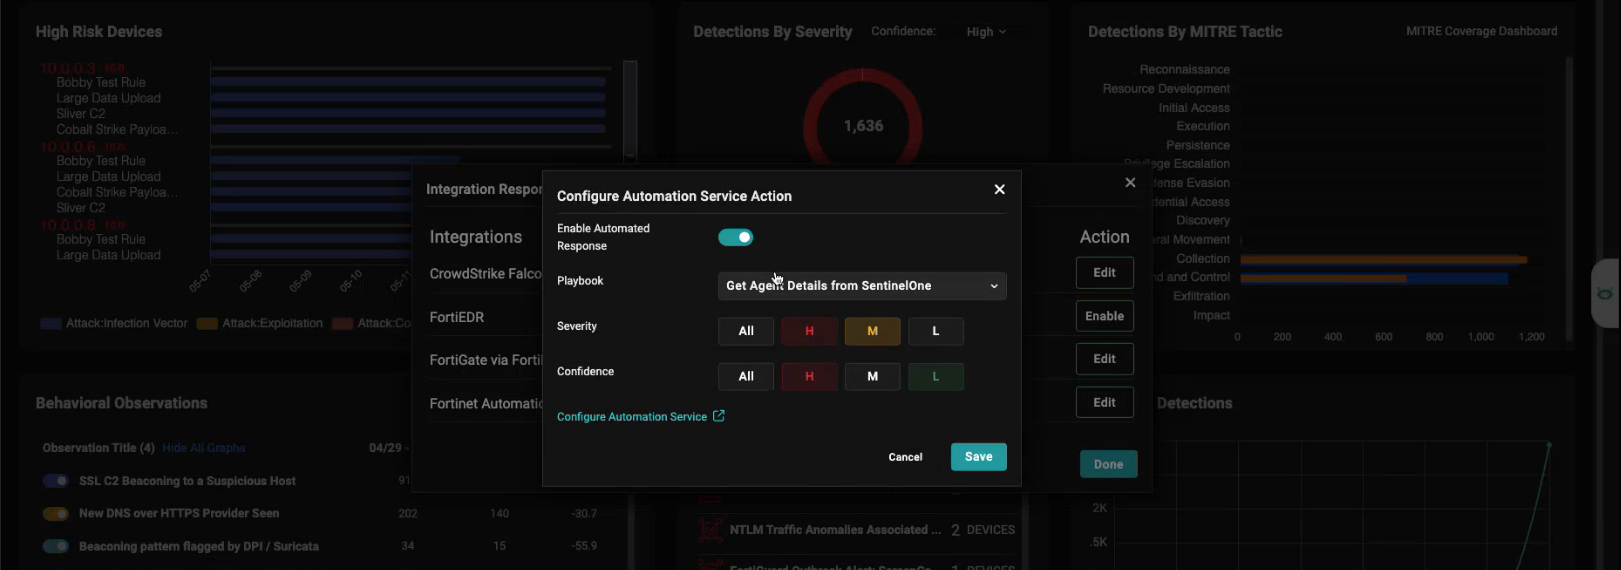
Automated Integration Response via Fortinet Automation Service
Fortinet Automation Service can be used to configure integration response actions. The Fortinet Automation Service requires a separate purchase and must be enabled per account. Playbooks depend on configured connectors, and administrators are directed to the connector configuration page to complete setup.
To enable response configuration, go to Detections > Response Configuration.
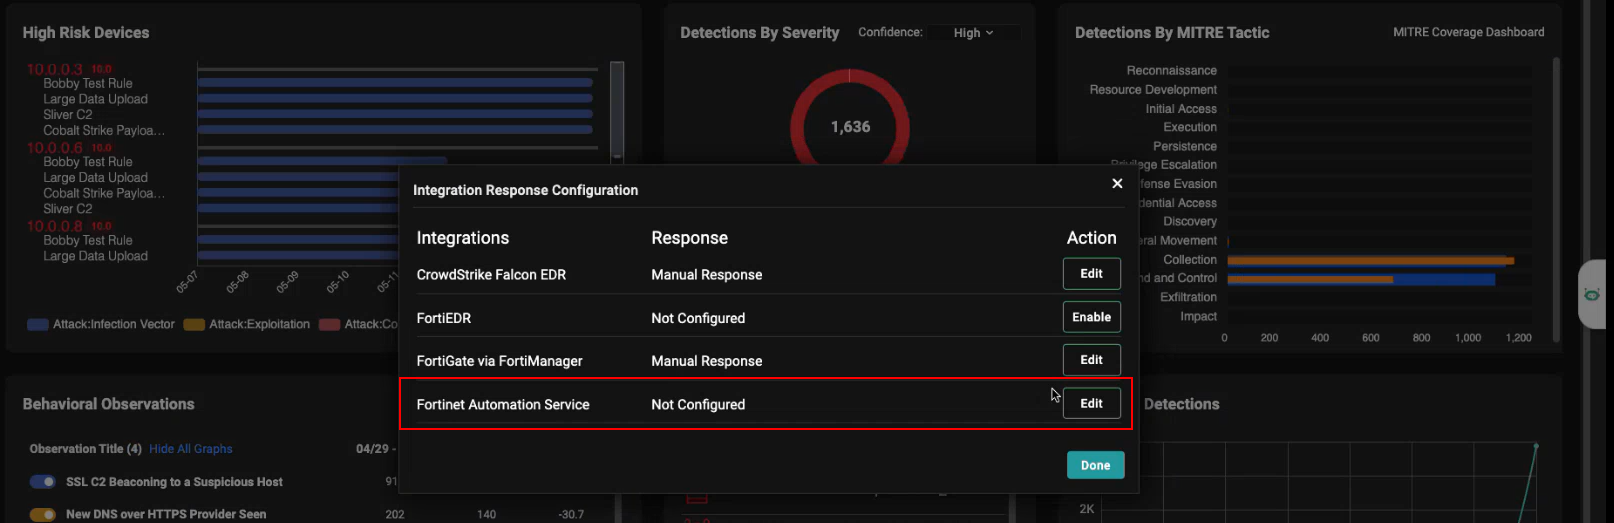
When enabled, administrators can run automation playbooks, such as creating ServiceNow incidents based on detection criteria, including severity or confidence levels.
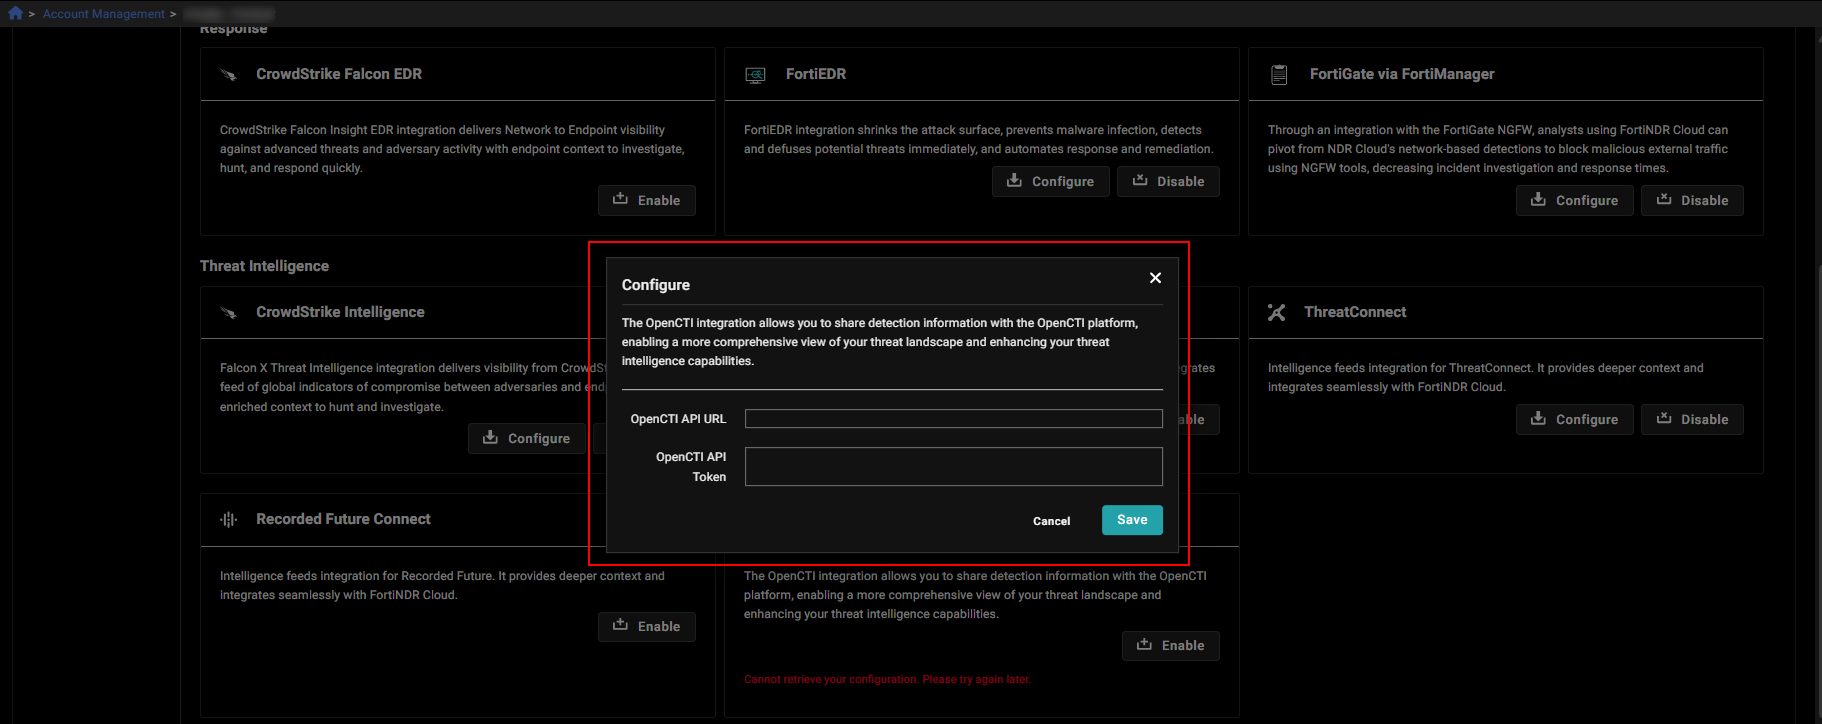
OpenCTI integration
Added support for OpenCTI integration on the Account Management page. Administrators can configure the integration by providing a URL and API token, and enable or disable it as needed. Once enabled, the integration allows FortiNDR Cloud to leverage OpenCTI as a threat intelligence source to enrich detections and improve visibility into the threat landscape.
To enable the OpenCTI integration, go to Settings > Account Management > Modules.
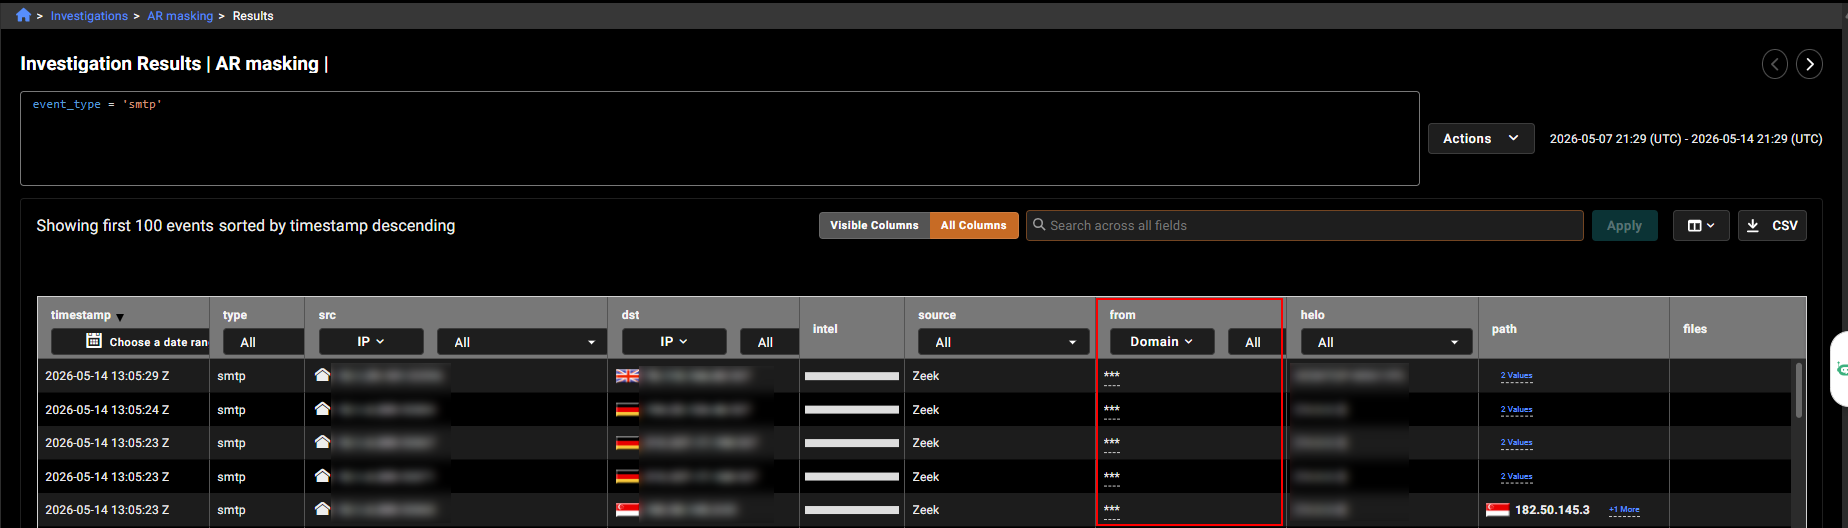
Data Masking
Data Masking hides sensitive information in investigation results and event data. Data masking is configured at the account level and, when enabled, masks sensitive fields in new data returned by IQL and Natural Language queries. Detection events are not affected by data masking and continue to display unmasked data.
When data masking is enabled, the following fields are masked:
- HTTP.username
- FTP.username
- SMTP.from_enriched_email, from_enriched_name
- SMTP.reply_to_enriched_email, reply_to_enriched_name
- NTLM.username
- Kerberos.client
To enable Data Masking, go to Settings > Account Management > Settings.
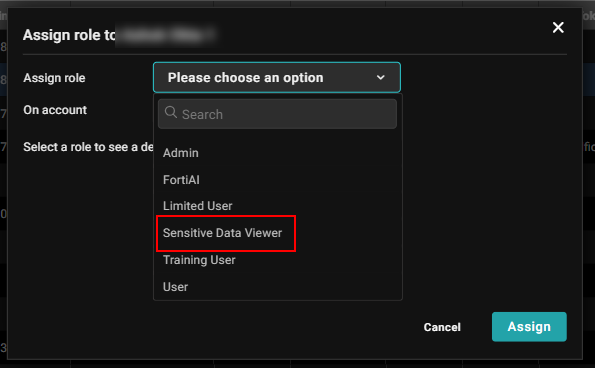
Access to unmasked data is controlled through the Sensitive Data Viewer user role. Results are determined by the role of the user who first runs the query:
- If created by a user without masking, all viewers see unmasked data;
- If created with masking, all viewers see masked data, including those with the Sensitive Data User role.
Masking is applied at query execution time and persists with the saved results, supporting consistent auditing and data privacy compliance.
Improved functionality
Fortinet Automation Service Solution Pack 1.0.4
Fortinet Automation Service Solution Pack 1.0.4 includes new connectors and playbooks to expand integration and response capabilities:
- New connectors: Palo Alto Firewall and Kaspersky Security Center.
- Infoblox DDI integration: Includes a new connector and a playbook to retrieve IP address information.
- FortiDeceptor integration update: Enhances the existing connector with a new playbook to fetch decoy assets and annotate IPs, helping identify whether detections involve decoy systems.
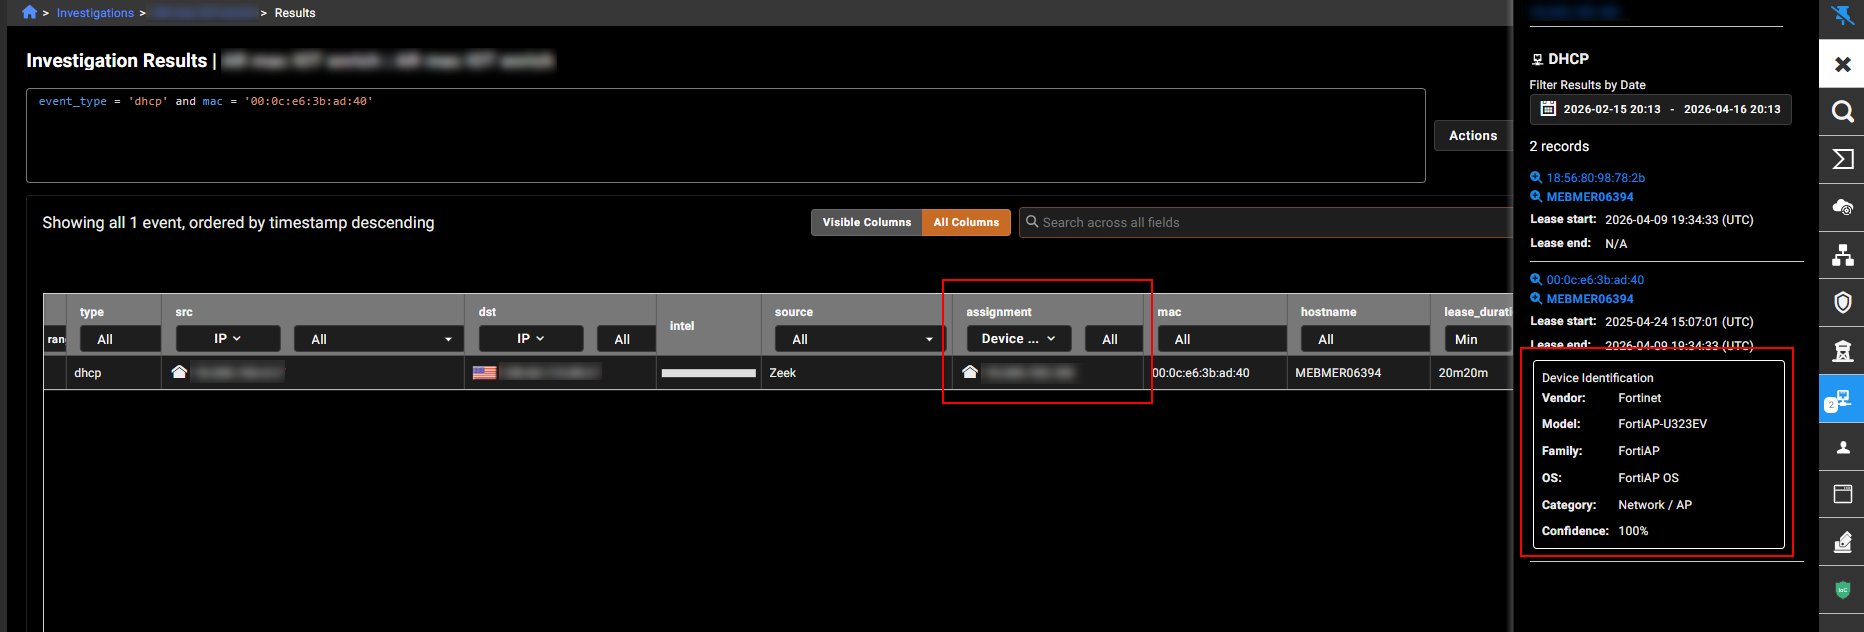
Device Mac address Enrichments using FortiGuard IoT DB
Added support for FortiGuard IoT Device Database integration to enhance device visibility with enriched data in FortiNDR Cloud. This update introduces a new Device Identification section in the DHCP tab of the Entity Panel, using MAC address–based enrichment to provide additional context about discovered devices, aligned with on-premises capabilities. To view this information, click the IP address in the Assignment column.
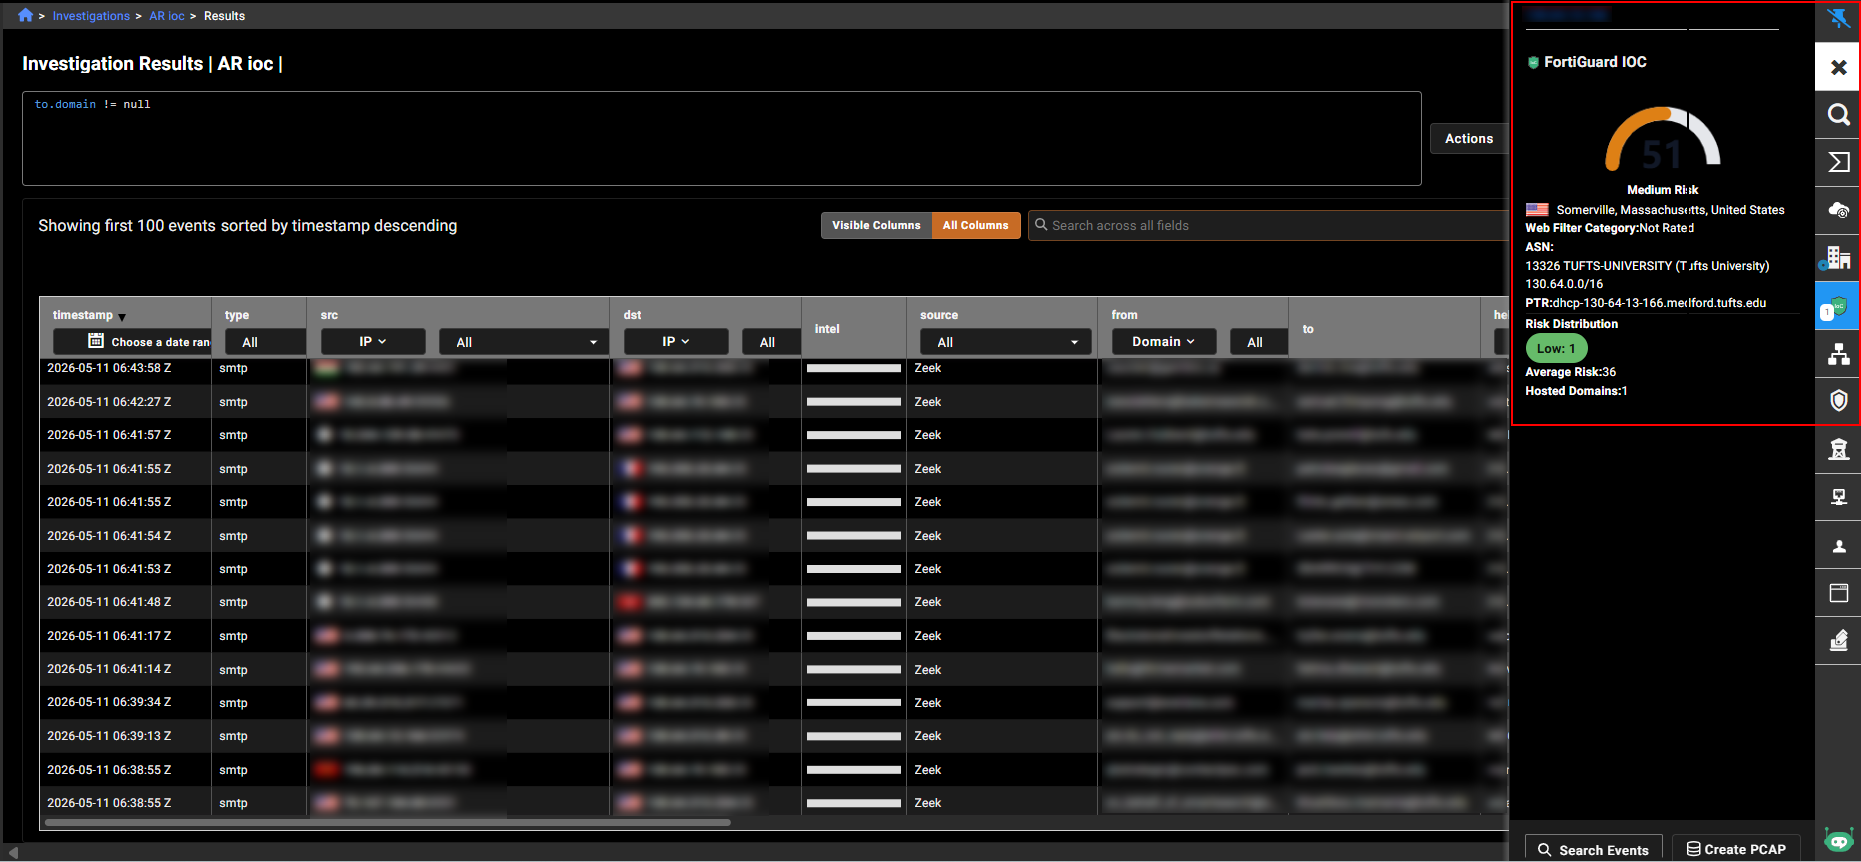
Indicator Enrichments using Fortinet IoC Database
The Entity Panel now displays Indicators of Compromise (IOCs) enriched from the Fortinet IOC database. When viewing an IP address, domain, or file hash in an investigation, a new IOC section provides risk and contextual information specific to that entity type.
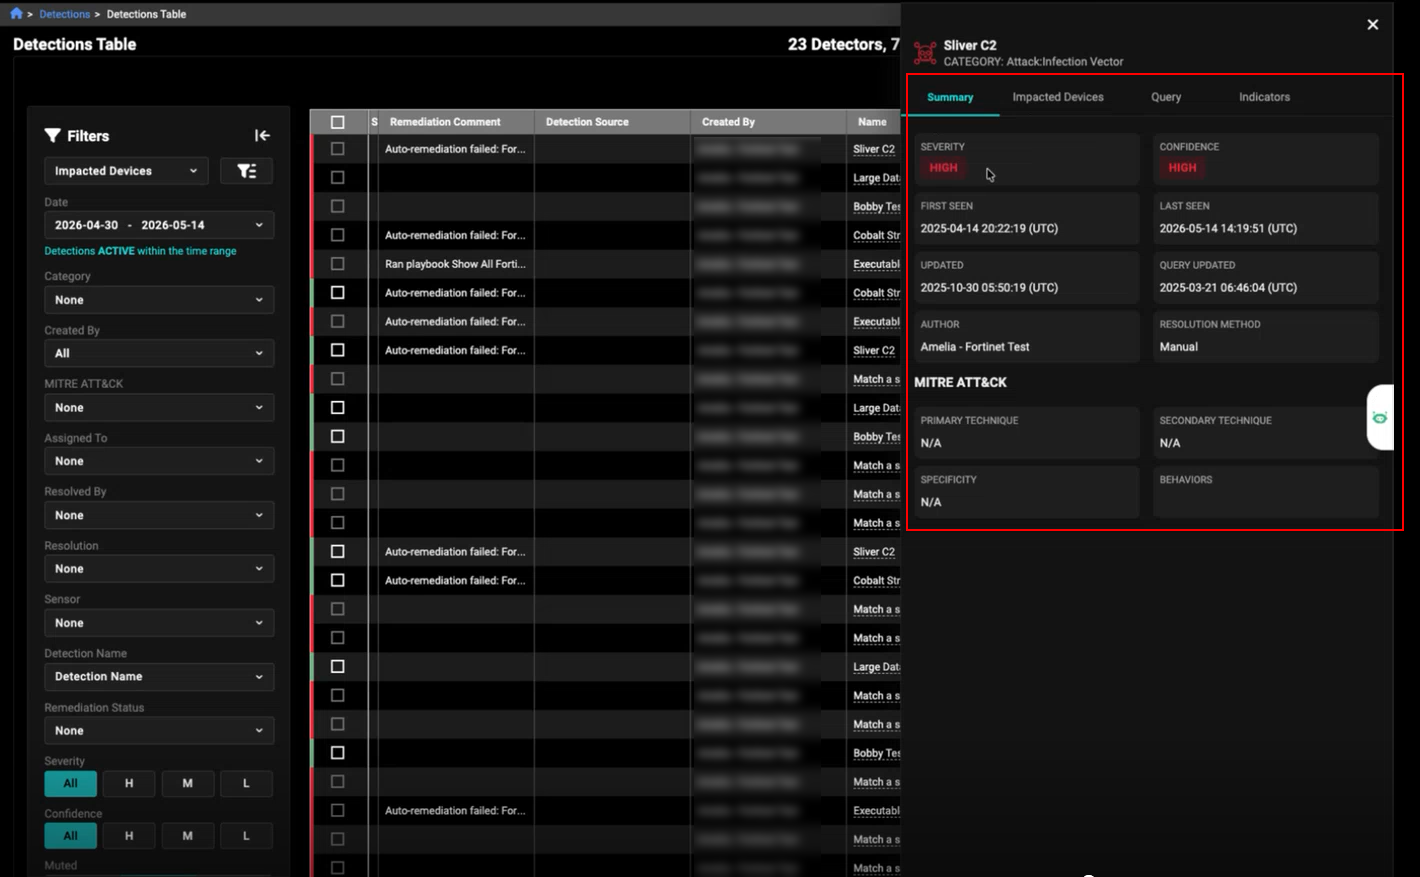
Detection Table Navigation Improvements
The Detections Table has been enhanced with an in-context detail panel that allows users to view detection details, related information, and perform actions without leaving the page. This update improves analyst navigation by reducing the number of clicks and minimizing page transitions, while still retaining the dedicated detection details page when needed.
To display the detection panel, click on the detection name in the Detections Table.
Other Improvements
- The Investigation Details page includes styling updates that standardize the look and feel of UI elements. Text boxes, buttons, dropdowns, and toggles are now consistent in appearance, size, and behavior across the page and the wider application.
-
Introduced inner_vlan and outer_vlan fields for Flow events, and a client_curves field for SSL events.
-
The hostname information in events has been improved for better clarity and consistency.
-
Detection Triage has been improved with a redesigned Detection Details page that preserves existing functionality while providing a more streamlined and consistent layout.
-
Filters applied on the Triage Detectors page are also applied on the Manage My Detectors page.
-
Added a right‑click Copy to Clipboard option for fields that support copying.
-
Added support for right‑click navigation that allows users to open detection and observation details directly in a new tab from names in the table or timeline, enabling quicker access to related information without disrupting the current workflow.
-
Added a right‑click Device Timeline option for IP addresses, allowing users to navigate directly to the Detection Timeline view filtered to that IP and its associated time range. This option is available across the portal, including detection views and panels, enabling quick pivoting to related activity while allowing users to further refine or clear filters as needed.