Fortinet white logo
Fortinet white logo

User Guide

24.4.0

Gauge

Gauge

The Gauge widget allows you to visually represent a specific metric level for a single instance where there is a logical upper bound. For metrics based on percentages, the upper bound will automatically set to 100%. For non-percentage based metrics, you will need to enter a value. If the metric level has breached a configured threshold, the gauge color will change from green to either red/orange, based on the severity.

Use case

The Gauge widget is useful when:

  • you want to display the current value of a single metric in an instance

Examples

CPU utilization (percentage)

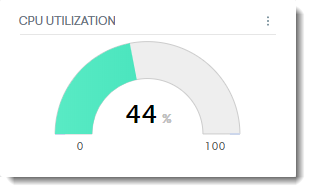
In this example, the Gauge shows the CPU utilization percentage of an instance.
Number of processes running

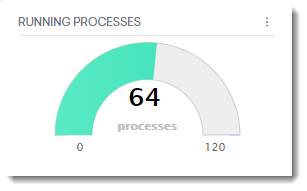
In this example, the Gauge shows the number of processes running on an instance. The threshold (120) can be configured using the Max Value field on the widget configuration drawer.
Configuration

When creating or editing a widget, a drawer that shows the widget's configuration options slides out from the right. Each configurable option is described in the following table.

Field

Description

Widget name

Name of the widget as it appears on the dashboard.

This field shows the default name of the widget. Select the pen icon to rename the widget.

Metric

The selected metric's value is displayed on the widget.

Max Value

Use this field to set an upper value or threshold for metrics not based on percentages

Dashboard Scoping Adherence

Enabling this option will allow you to bypass Dashboard-level scoping.

Gauge

Gauge

The Gauge widget allows you to visually represent a specific metric level for a single instance where there is a logical upper bound. For metrics based on percentages, the upper bound will automatically set to 100%. For non-percentage based metrics, you will need to enter a value. If the metric level has breached a configured threshold, the gauge color will change from green to either red/orange, based on the severity.

Use case

The Gauge widget is useful when:

  • you want to display the current value of a single metric in an instance

Examples

CPU utilization (percentage)

In this example, the Gauge shows the CPU utilization percentage of an instance.

Number of processes running

In this example, the Gauge shows the number of processes running on an instance. The threshold (120) can be configured using the Max Value field on the widget configuration drawer.

Configuration

When creating or editing a widget, a drawer that shows the widget's configuration options slides out from the right. Each configurable option is described in the following table.

Field

Description

Widget name

Name of the widget as it appears on the dashboard.

This field shows the default name of the widget. Select the pen icon to rename the widget.

Metric

The selected metric's value is displayed on the widget.

Max Value

Use this field to set an upper value or threshold for metrics not based on percentages

Dashboard Scoping Adherence

Enabling this option will allow you to bypass Dashboard-level scoping.