


Browser synthetic (multistep) check
Browser synthetic monitoring allows you to simulate user interactions with your web applications, providing important insights into the application’s availability and performance. Before you get started, download the Katalon Recorder extension for Chrome. Katalon records browser interactions and outputs them into a format that can be executed by FortiMonitor. Use this to either create simple scripts or assist in exploratory testing.
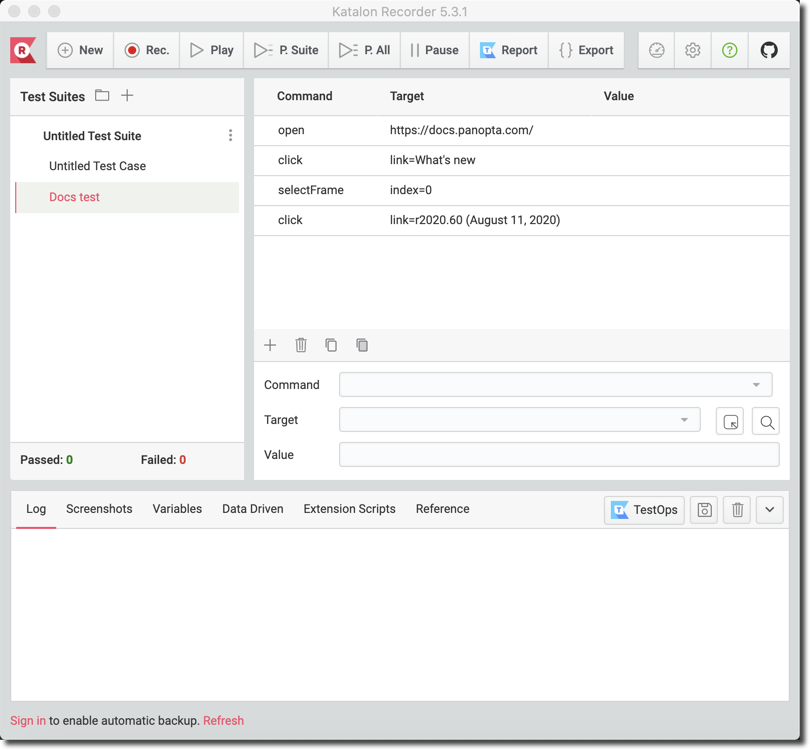
Below is what the Katalon IDE plugin looks like when opened:
Record browser interaction using Katalon
Once you have added the Katalon extension, record a browser interaction by performing the following steps:
-
Allow Katalon to start browsers in private mode.
-
Make sure to clear your cookies and browsing data.
-
Open a browser in private/ incognito mode.
-
Start the extension from your browser’s extensions menu.
-
Click the record button to start capturing your clicks and key presses.

-
Katalon will record all of your browsing actions until you click Stop. To learn more Katalon Docs.

-
Once your test session is complete, export the test as XML by clicking Export.

-
Under Format, select XML.

-
Click Copy to Clipboard or save the file. This source code will be used to configure the check in the Control Panel.
-
Go to your Control Panel and start setting up the check. See the following section.
For a list of supported multistep commands, see Available multistep commands.
You may run into browser issues when recording in incognito mode. Allowing 3rd party cookies in your incognito session will help alleviate that.
Metric configuration
-
From the Control Panel, go to the Instance Details page of the instance where you want to add browser synthetic monitoring.
-
In the Monitoring Config tab, click Add Monitoring. The Monitoring Catalog will be displayed.
-
Select Configure under the HTTP or HTTPS cards. If you have not added any of these services, you will see an Add button instead of Configure.
-
Select Browser Synthetic (Multistep) check from the metric list.
-
Under Check Source > Selenium Source, enter the source code that you exported from Katalon.

-
Optionally, configure the metric’s settings. See Configure incident alert and thresholds for more information.
Test your browser synthetic check
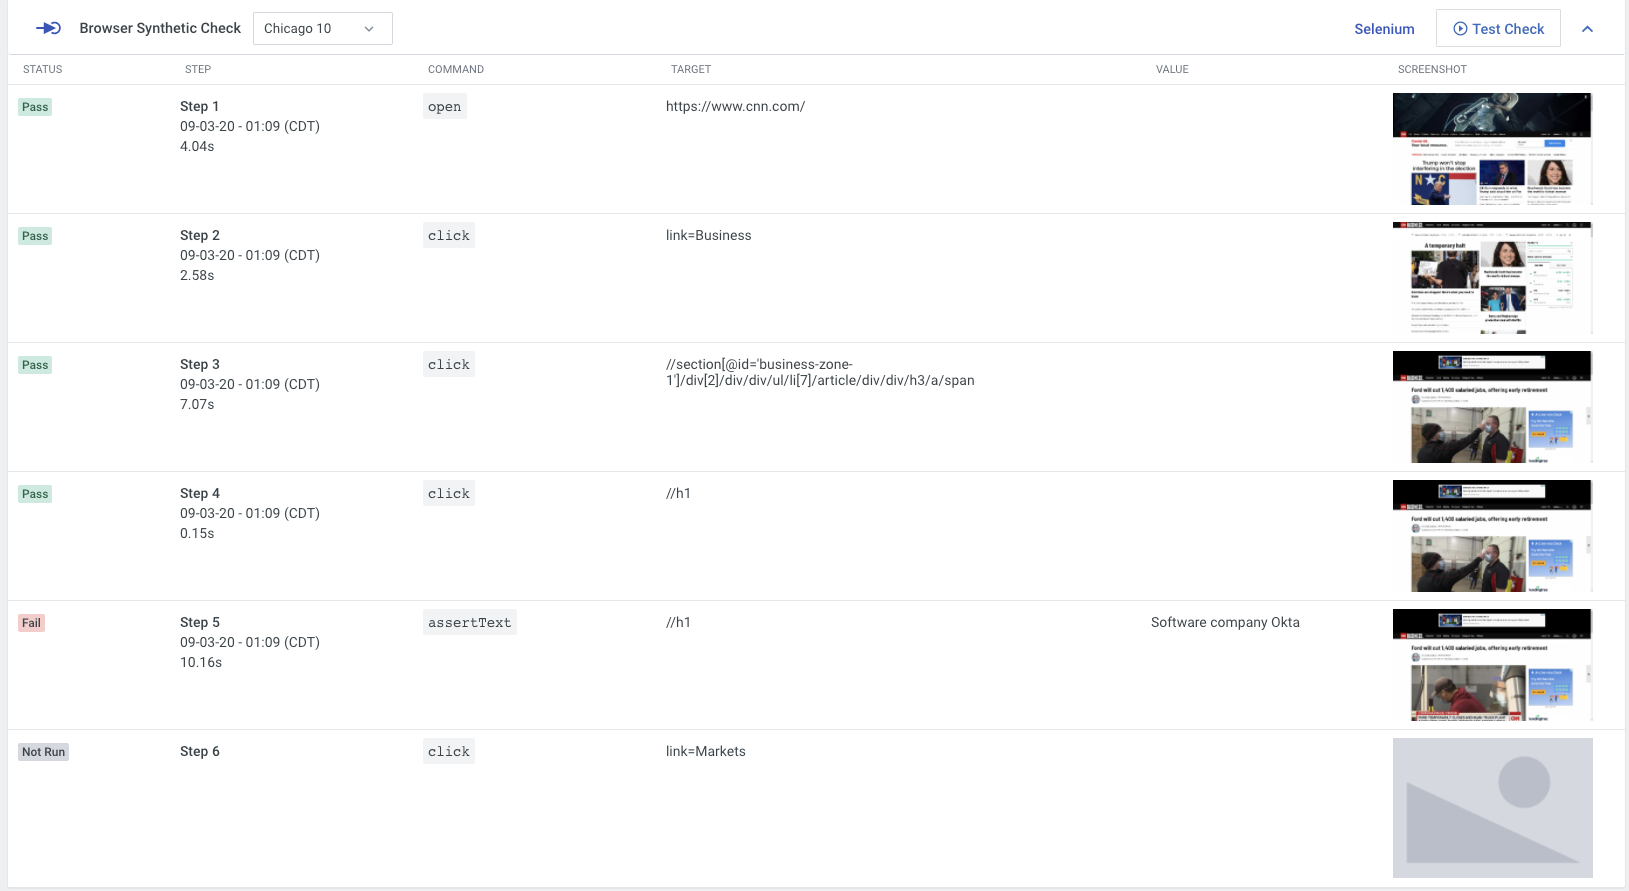
To test your browser synthetic check, click Test Check.

The following details are displayed in the metric’s drawer:
-
The status of each executed step
-
The command and the target of each step
-
The elapsed time to execute each step
-
Screenshots of each step
The test outputcan also help you identify any bottlenecks that are affecting your web application’s page load times, allowing you to make adjustments to improve its performance.
Incidents
Once you save a browser synthetic check and it starts running, an incident will be created in the Incident Hub if the check fails. Open the incident’s details page then expand the Browser Synthetic Check section to show the test results and any failure point.
If you want to re-test the check, you can perform a real-time test by clicking Test Check.