


Network device monitoring
Add a network device manually
-
Select + Add from the navigation menu then select Network Device (Advanced).

-
Select which OnSight you would like to monitor the device from then click Next Step.
-
Add the FQDN or IP address of the device, and select which group to put the device into. You can also create a new group by clicking Create new group.

-
(Optional) Enable the Bulk Entry option if you want to add more than one.
-
If no valid SNMP credentials match while adding network devices by bulk, a banner showing the status will be displayed. This banner will also show if the device has an assigned credential and if the last scan that was ran failed.

-
-
(Optional) Enable the Process through Monitoring Policy Workflow option to send the network devices to the Monitoring Policy Workflow for processing.
-
(Optional) Add attributes
-
Select an existing SNMP credential for the device.
-
Once the credentials have been verified, you can proceed with configuring the device (templates, tags).
If the credentials did not match, you will have the option to choose different credentials. For bulk entries, network devices that have failed can be removed by clicking Remove Device.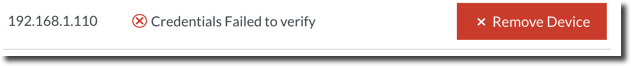
-
Select Add Device, the new device will populate under the group you selected.
After adding the network device, the OnSight automatically detects its type and then provisions the standard metrics applicable to the device.
Add network devices with OnSight Discovery
To add network devices that your OnSight vCollector has discovered:
-
Go to the OnSight page and select Discovered Instances. If you do not know how to set up discovery in your account, see OnSight Discovery.
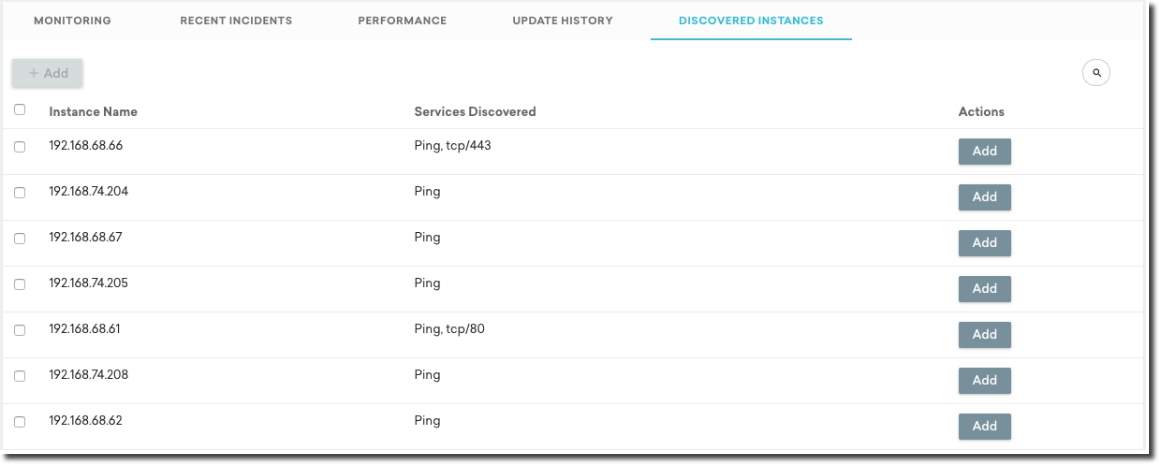
You will see the IP address or the instance name of the device that had been discovered and the services which were discovered on the device. The checkbox allows you to select multiple instances.
-
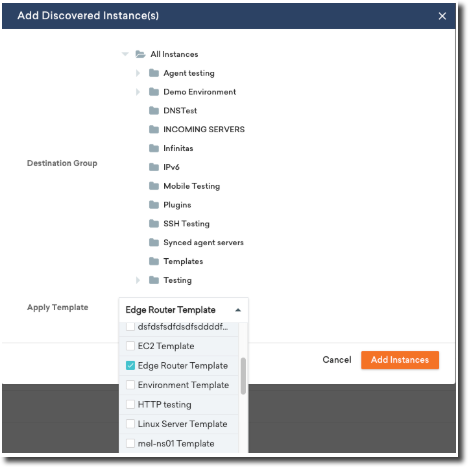
Once instances are selected, choose the destination group and if required, apply a template.
After adding the network device, the OnSight automatically detects its type and then provisions the standard metrics applicable to the device.
You can also monitor SNMP with SNMP traps.
Configure the network device
To configure a network device, perform the following steps:
-
Go to the Instance Details page of the network device that you want to configure.
-
Select the name of the network device or the Edit icon.
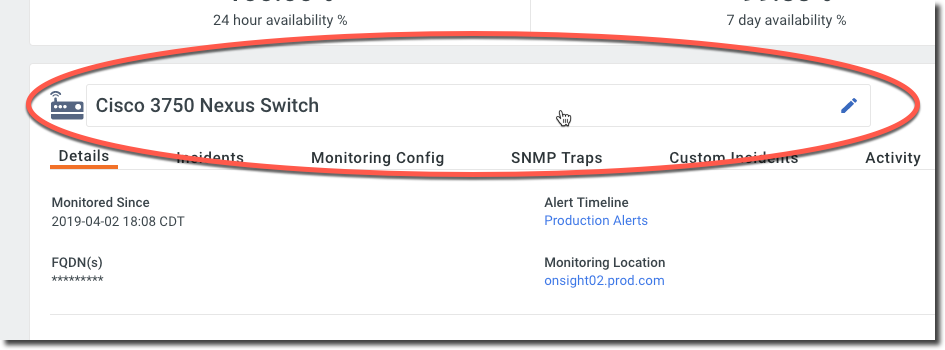
The OnSight Configuration drawer will slide out.
-
Edit the following settings as needed:
|
Option |
Description |
|---|---|
|
General |
|
|
Name |
Change the name of the network device. |
|
Server Key |
The unique key used to reference this device. |
|
Instance Group |
Select an instance group for the network device. |
|
Tags |
Enter tags that can help define the network device. For example network, cisco. Press Enter after each tag. Known tags will be auto-suggested to you. Tags should not contain spaces. |
|
Attributes |
Add key-value pairs that can provide more structure to your instance metadata. |
|
FQDNs and IPs |
Add additional interface names. See Additional IP addresses or FQDNs. |
|
Description |
Enter a description for the template. |
|
Parent Instance |
(Optional) The device upstream from this server that it depends on. If the parent device experiences an outage, this server's outage notifications will be suppressed. |
|
Prometheus Endpoints |
Add a Prometheus endpoint to the network device. |
|
SNMP Credentials |
Add an SNMP credential to the template. |
|
Select Credentials |
The SNMP credential used for this device. |
|
Recurring SNMP Discovery |
Enable this option if you want the OnSight to regularly scan the network device. Detected metrics will automatically be provisioned. |
|
SNMP Scan Frequency |
This option only appears when the Recurring SNMP Discovery option is enabled. Specify how often (minutes) the network device is scanned for new metrics. |
|
Port Metric Provisioning |
Enable this option to auto-provision SNMP metrics. |
-
Select
Save Changes.
Monitor metric performance
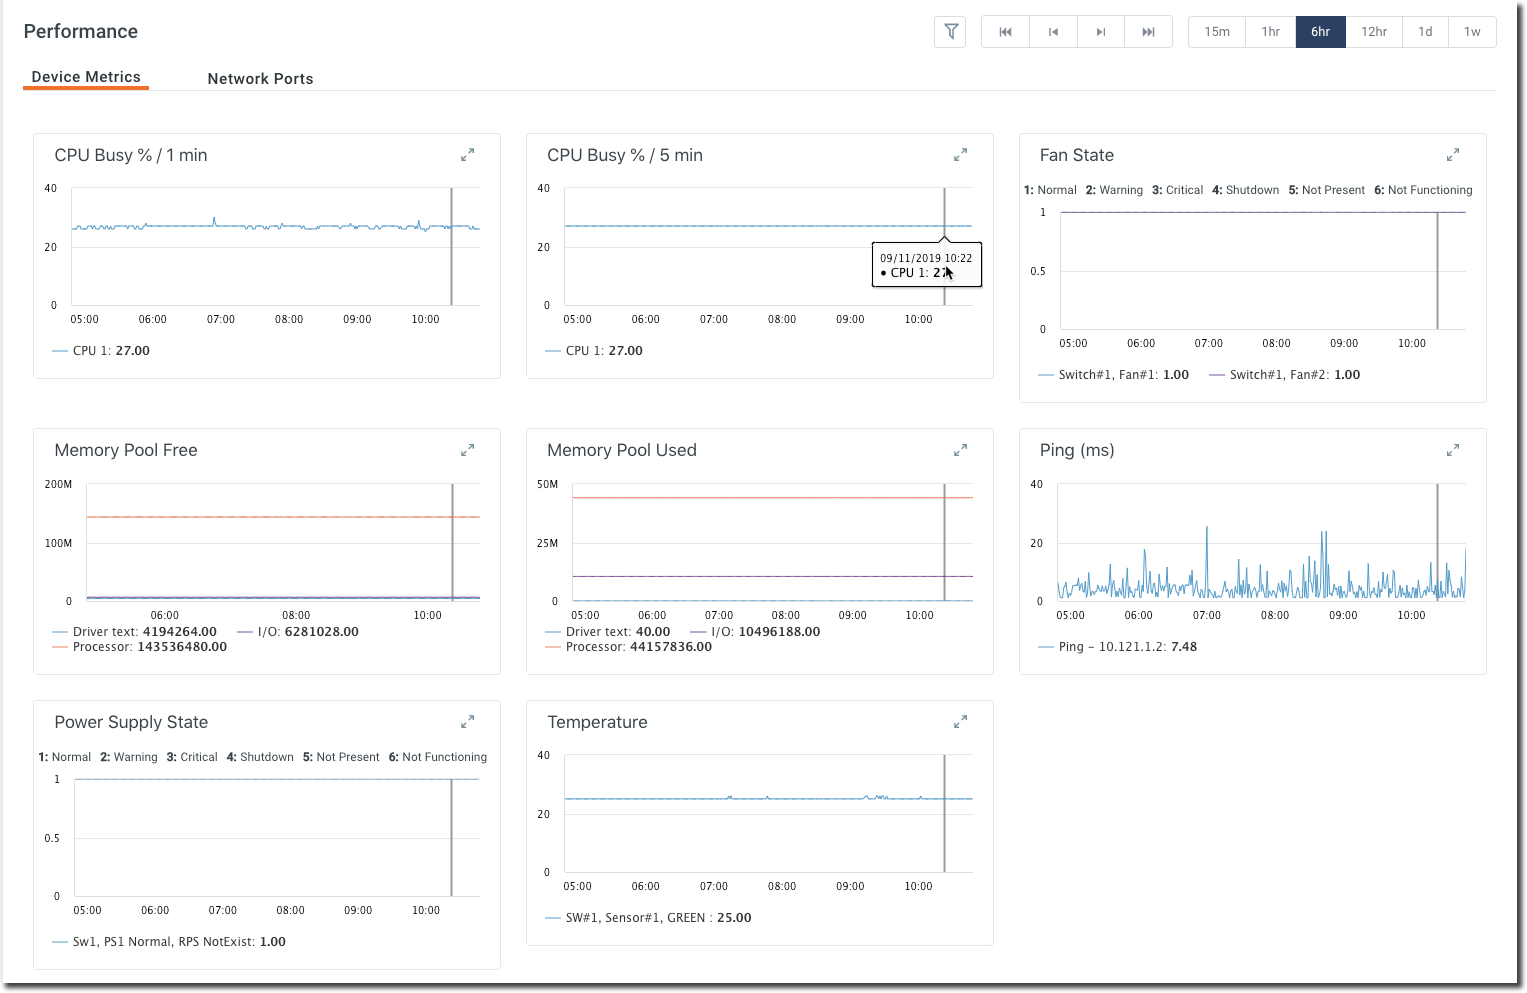
In the Performance section of the network device's Instance Details page, each metric is presented differently. Device-level metrics use performance line charts along the top.
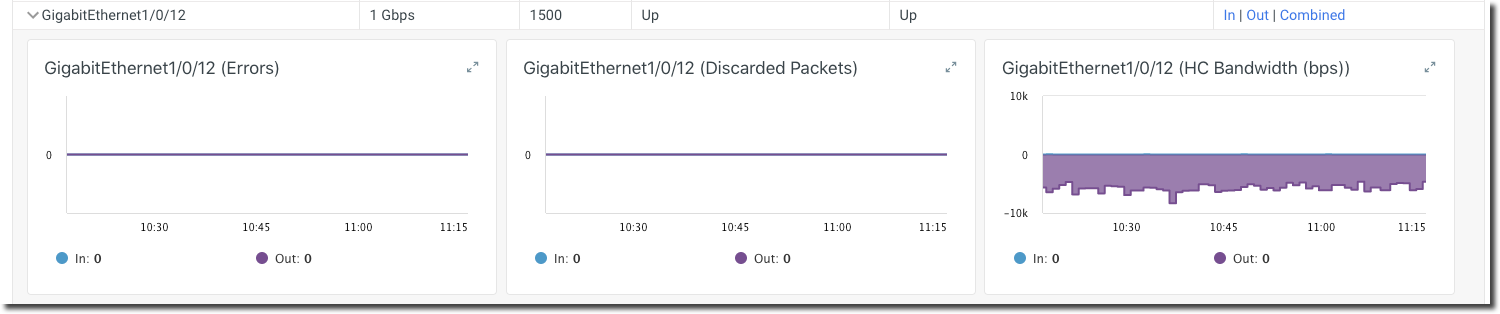
Port/interface-level metrics use a customized roll up display which shows interface stats in expandable rows.

Click on a specific row to expose all interface-specific performance and health metrics. The graphs will show both inbound/outbound stats stacked on the same graph with zooming ability. Click on the expand icon in the upper right-hand corner of a graph to see a fullscreen display.
Using templates allows you to standardize your thresholds set and alerts and implement them across similar devices.