Application monitoring
The Application Monitoring solution can ensure that applications and services are available, functional, and are meeting expectations from a customer’s perspective in real time. FortiMonitor allows you to capture application performance data, synthetic monitoring, and network checks to understand a customer’s digital experience and support your organization’s key performance indicators.
Application monitoring also allows you to collect, view, and analyze several metrics to ensure that your customer’s experience is seamless and as intended.
An application can be defined as a collection of target instances which can be monitored from a number of monitoring sources, allowing you to measure performance from different vantage points:
-
Public probe - Global network of monitoring nodes designed to track the availability of your servers 24 hours a day from outside your network.
-
OnSight - The OnSight vCollector sits behind your firewall and functions similarly to our public monitoring nodes, which runs uptime checks and synthetic monitoring against your publicly available servers and web endpoints. The OnSight can be used to verify performance from core office or data center environments.
-
Endpoint Agents (DEM Agent) - Collects key OS health and application performance metrics from remote locations like employee computers, retail locations, or public probes for external verification.
-
SD-WAN device - Provides accurate user-level performance statistics to gain insight into the SD-WAN traffic performance.
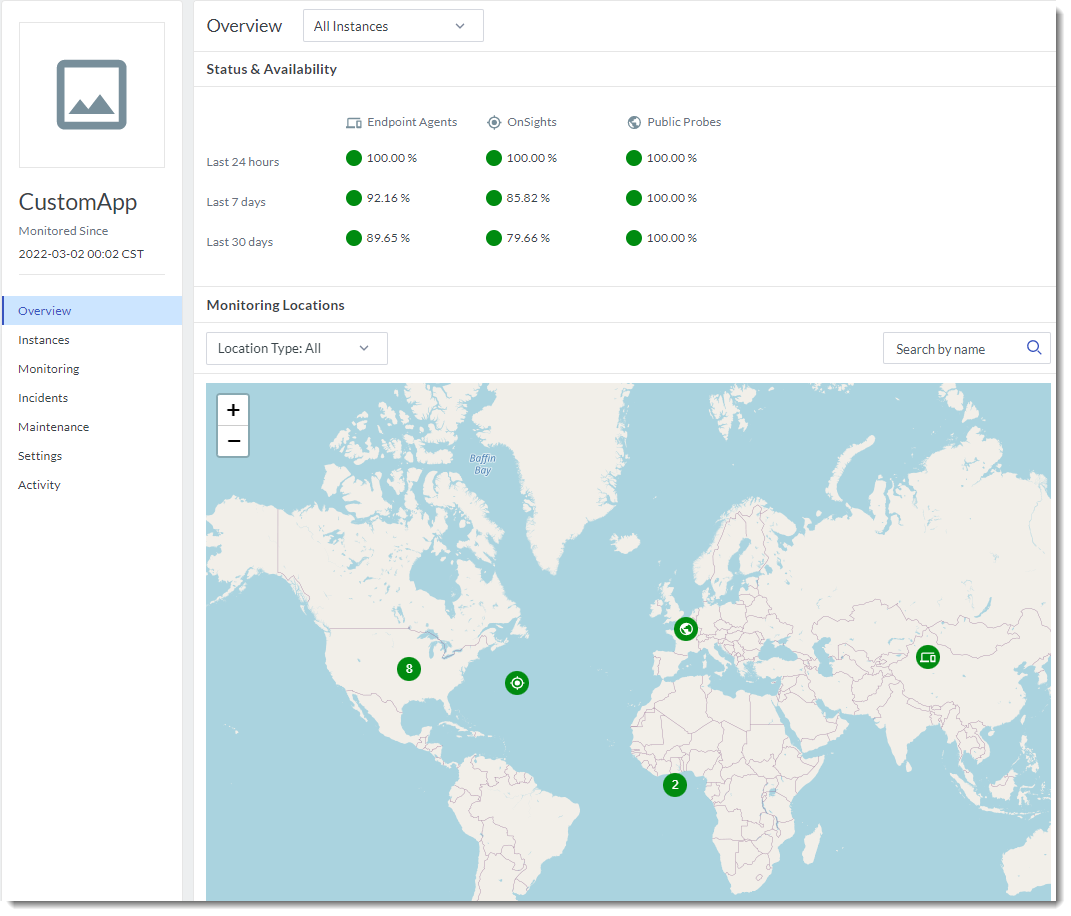
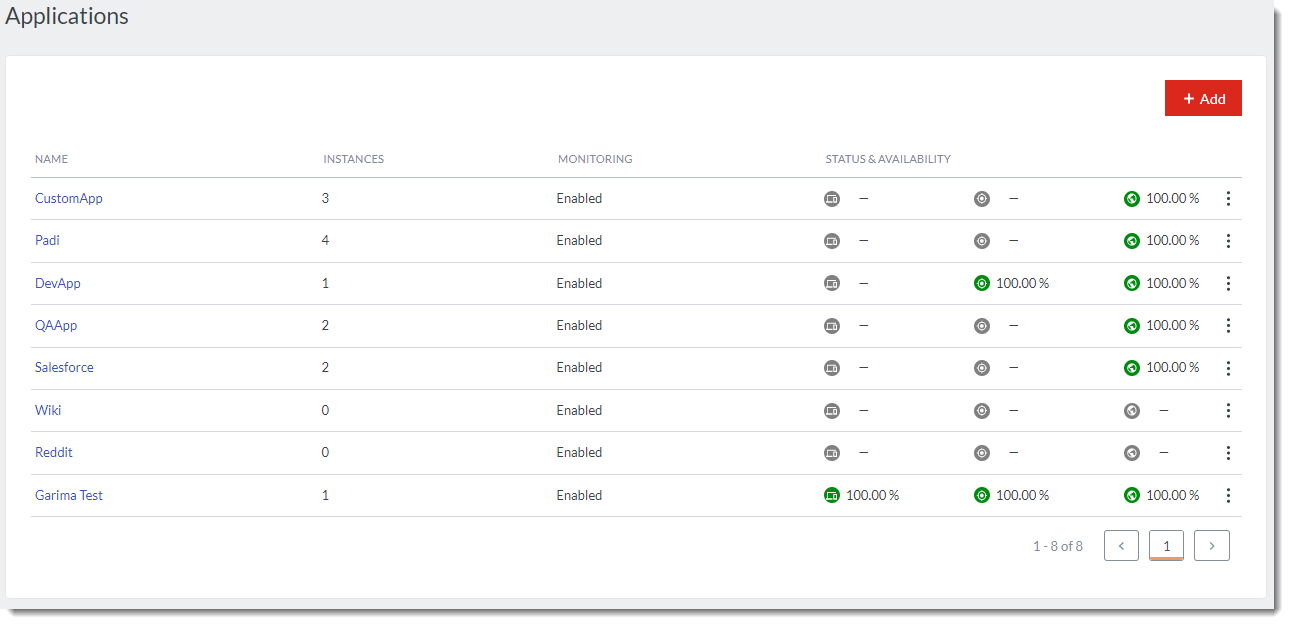
The Application Monitoring page shows a focused view of the application and it instances. This page displays the following information:
-
Applications you have created
-
The number of instances associated with each application
-
Monitoring status (Enabled/ Disabled)
-
Status and availability
The page is described in detail in Get started with Application monitoring.
Custom and default applications
When adding applications to FortiMonitor, you have the option to create custom applications, or use default applications. Default applications are pre-configured checks for common applications such as Salesforce or Zoom. With default applications, instances and checks are configured out-of-the box to satisfy the monitoring requirements of an application.
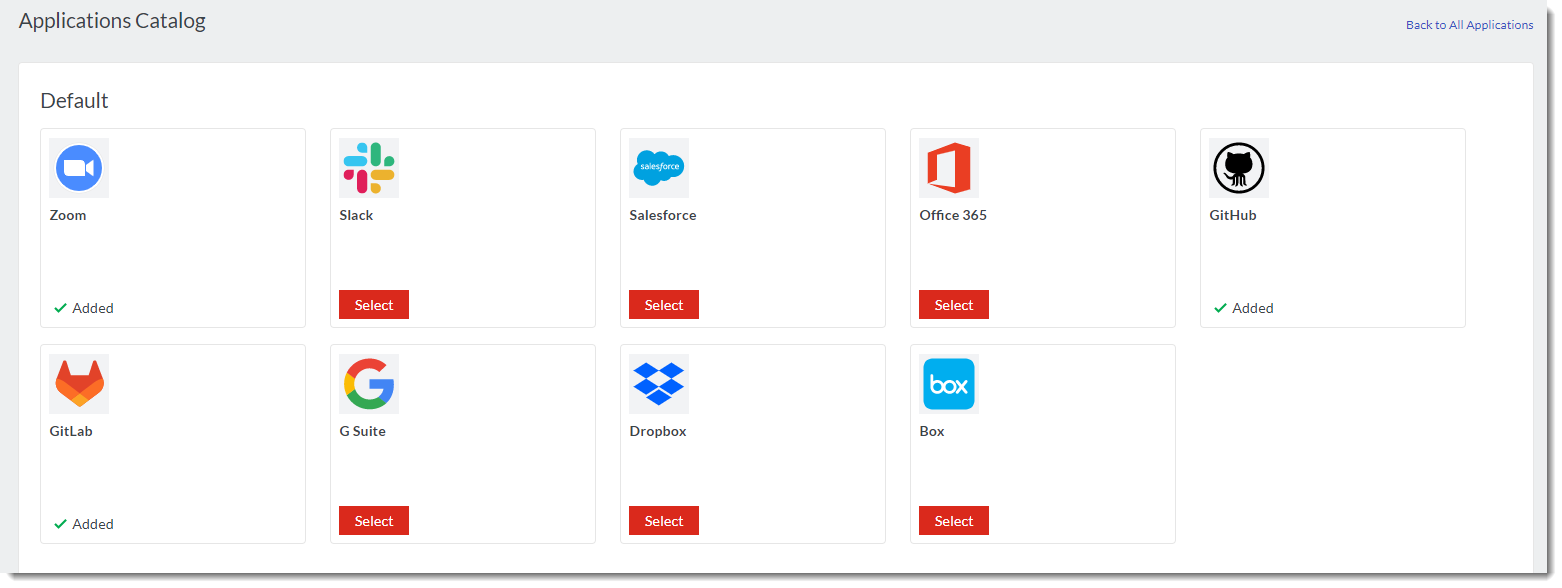
As of writing, the following default applications are available:
-
Zoom
-
Slack
-
Salesforce
-
Office 365
-
GitHub
-
GitLab
-
G Suite
-
Dropbox
-
Box
Application monitoring usage examples
The following sections provide examples and use cases on how Application Monitoring can help with your customer’s digital experience:
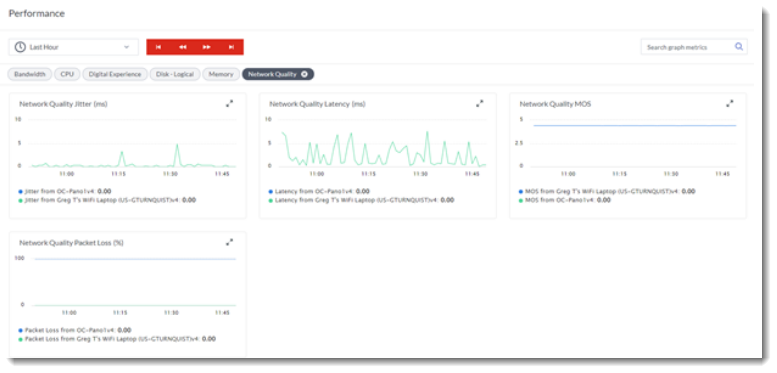
Overlay/underlay network quality
Application Monitoring can be used to collect detailed information about the network quality of active and backup links. This ability to measure the quality of backup links allows you to fix problems before there is an attempt to switch over to a backup link that is having network quality issues.
Measure application performance from multiple different vantage points
Application Monitoring can be used to report on the reachability and performance of important applications like Zoom and Teams from multiple different perspectives – endpoint, data center, and public test locations.
For any given application, you can quickly drill down and see what the performance and availability looks like from multiple different perspectives, including actionable information that allows you to quickly isolate the issue.