Synthetic monitoring
Synthetic checks can be run from any of our monitoring locations. You can also use the OnSight vCollector to run Synthetic Monitoring checks from within your private network.
Synthetic Monitoring check types
Basic synthetic checks
The following check types are available:
-
HTTP/HTTPS port
-
HTTP/HTTPS HEAD
-
HTTP/HTTPS check
HTTP and HTTPS checks are simple tests to see if a destination, such as a port, website, content, or more, is responding correctly.
HEAD checks are used to ask only for information about the page and not the whole page itself. This can be useful if you do not want to use up your servers' bandwidth or use unnecessary resources.
See HTTP and HTTPS for more information.
Browser synthetic checks
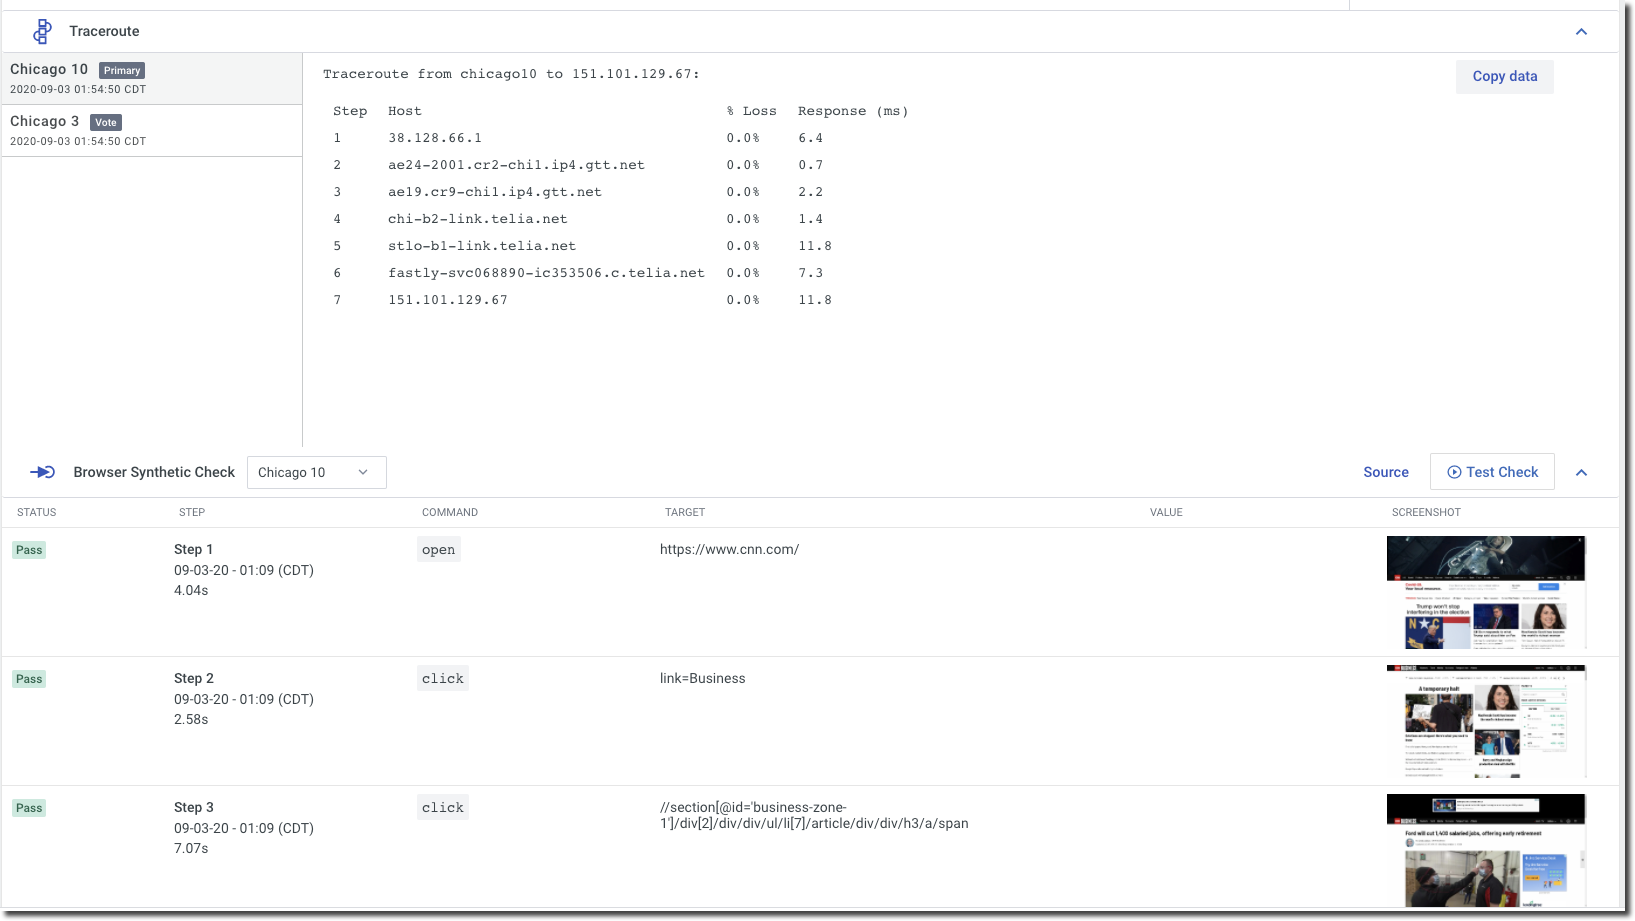
Browser synthetic checks validate user interaction with your web applications using Selenium. The output of browser synthetic checks can help you validate that your application is enabling the outcome you expect for customers. The following details are provided:
-
The status of each executed step
-
The command and the target of each step
-
The elapsed time to execute each step
-
Screenshots of each step
Use Katalon Recorder extension for Chrome to simulate a user session.
See Browser synthetic (multistep) checks for more information.
JavaScript synthetic checks
JavaScript synthetic checks are used for advanced tests that involve complex actions. To learn more about JS synthetic checks see JavaScript synthetic checks.
Test checks and Traceroute
Synthetic Monitoring in FortiMonitor also offers a way for you to check your synthetic checks directly from a metric’s configuration drawer. To perform a Test Check, simply click the Test Check button and the test that you have configured will be performed in real-time.
The following screenshot shows the result of an HTTP check:

Traceroute tracks in real-time the pathway taken by a packet from source to destination. This can help you identify any delays or dropped packets when transmitting data. The following figure shows an example of a Traceroute output:

Incidents
Active Synthetic Monitoring checks will create incidents for any test that fails. The incidents will be available in the Incident Hub or the Instance Details page of the instance where you configured the check. The following image shows an example of an incident from a browser synthetic check.