


Part 7: CounterMeasures
This article describes the features and functionality of CounterMeasures. CounterMeasures are automated remediation and mitigation actions triggered by the FortiMonitor Agent whenever a metric threshold is crossed for more than a configured amount of time. Actions range from simple debugging commands (top,netstat, or vmstat) to complex actions such as making API calls or restarting a service when a threshold is breached. CounterMeasures can increase the level of automation within your operations workflow, either by using the out of the box FortiMonitor CounterMeasures or by creating your own.
CounterMeasures are represented throughout the control panel by a beaker icon. This icon indicating a configured CounterMeasure is available anywhere an incident is listed. You can also see a list of all the configured CounterMeasures in your account by going to Settings > CounterMeasures.
|
Note: To enable CounterMeasures, you need to have the latest version of the FortiMonitor Agent installed on your instance. See Update the FortiMonitor Agent to upgrade your Agent. |
Slack integration
One of the biggest benefits of CounterMeasures is the ability to quickly arm yourself with information when an incident arises. You can configure CounterMeasures to send the information it retrieves directly in Slack, saving you the time to log into the offending instance. See CounterMeasures Slack Integration for more information.
Enable CounterMeasures
Go to the following sections to learn more about enabling CounterMeasures on your instances:
Example workflow
CounterMeasures have a simple workflow that is driven by the FortiMonitor Agent. Here is an example:
-
Enable CounterMeasures in your Agent configuration file or manifest file.
-
Add a CounterMeasure to a metric threshold, such as Disk % used.
-
If the threshold is crossed, the CounterMeasure will be run.
Any output provided by the CounterMeasure will be attached to the incident record and will be available in the FortiMonitor control panel, incident log, or Slack.
CounterMeasure actions
Standard Linux CounterMeasure actions
Out of the box, the FortiMonitor Agent comes with standard CounterMeasure actions that can be utilized.
|
Action
|
Description
|
|---|---|
|
Top |
Displays information about CPU and memory utilization by process |
|
dmesg |
Displays information from the kernel |
|
Netstat |
Displays network connections for the TCP, routing tables, and a number of network interface and network protocol statistics |
|
Reboot Server |
Reboots the server |
|
Vmstat |
Retrieves the following virtual statistics: processes, memory, paging, block IO, traps, and CPU activity |
Standard Windows CounterMeasure actions
The following CounterMeasures are available if you have the Windows Agent installed.
|
Action
|
Description
|
|---|---|
|
Top |
Displays information about CPU and memory utilization by process |
|
Application Error Logs |
Retrieves the last 50 Application Error logs |
|
Get Service Status |
Retrieves the status of all running services |
|
Netstat |
Displays network connections for the TCP, routing tables, and a number of network interface and network protocol statistics |
|
Reboot |
Reboots the server |
|
Restart IIS |
Restarts the IIS web server service |
|
System Error Logs |
Retrieves the last 50 System Error logs |
|
Vmstat |
Retrieves the following virtual statistics: processes, memory, paging, block IO, traps, and CPU activity |
Custom actions
In addition to the standard CounterMeasure actions, you can also create your own by following the steps detailed in:
Remote actions
You can centrally manage your CounterMeasure plugins by adding the countermeasures_remote_plugins parameter to your Agent manifest file that points to an archive of Agent plugins. When the Agent is installed, it will download and extract the directory in the proper location. Zip, tar, and python file types are supported.
If you would like updates to your CounterMeasures plugins to automatically be applied, you can optionally set countermeasures_refresh_plugins to the number of hours for the refresh interval. This will help with keeping all your servers up-to-date.
See Utilizing Remote Actions for more information.
CounterMeasure metric threshold
CounterMeasures are configured together with metric thresholds. See Configure a CounterMeasure to configure CounterMeasures and thresholds. An orange beaker icon indicates that an approval is required. Selecting the icon displays a modal where you can approve the appropriate CounterMeasure.
Approval
An Approval option is available for situations where you don't want a CounterMeasure to execute without a final authorization. To require approval for CounterMeasure actions, select the Require Approval option when configuring the CounterMeasure.
CounterMeasure status
The CounterMeasureslife cycle is detailed in the following list:
-
Pending: state of an action that is scheduled to execute in the future and does not require approval or has already been approved. The beaker icon will appear grey.
-
Pending Approval: state of an action that is scheduled to execute in the future but will not do so until approved. The beaker icon will glow orange.
-
In Process: state of an action that has been synced down to the Agent to execute. The beaker icon will appear gray.
-
Complete: state of an action that has executed successfully. The beaker icon will appear green.
-
Error: state of an action that attempted to execute but returned an error while executing. The beaker icon will appear red.
-
Skipped: state of an action that was at one time pending but whose underlying incident was resolved before executing. The beaker icon will appear grey.
CounterMeasure output
You can view a CounterMeasure's output from the following:
-
CounterMeasures details panel
-
Incident details page
The following figure shows the CounterMeasure output from the outage log.
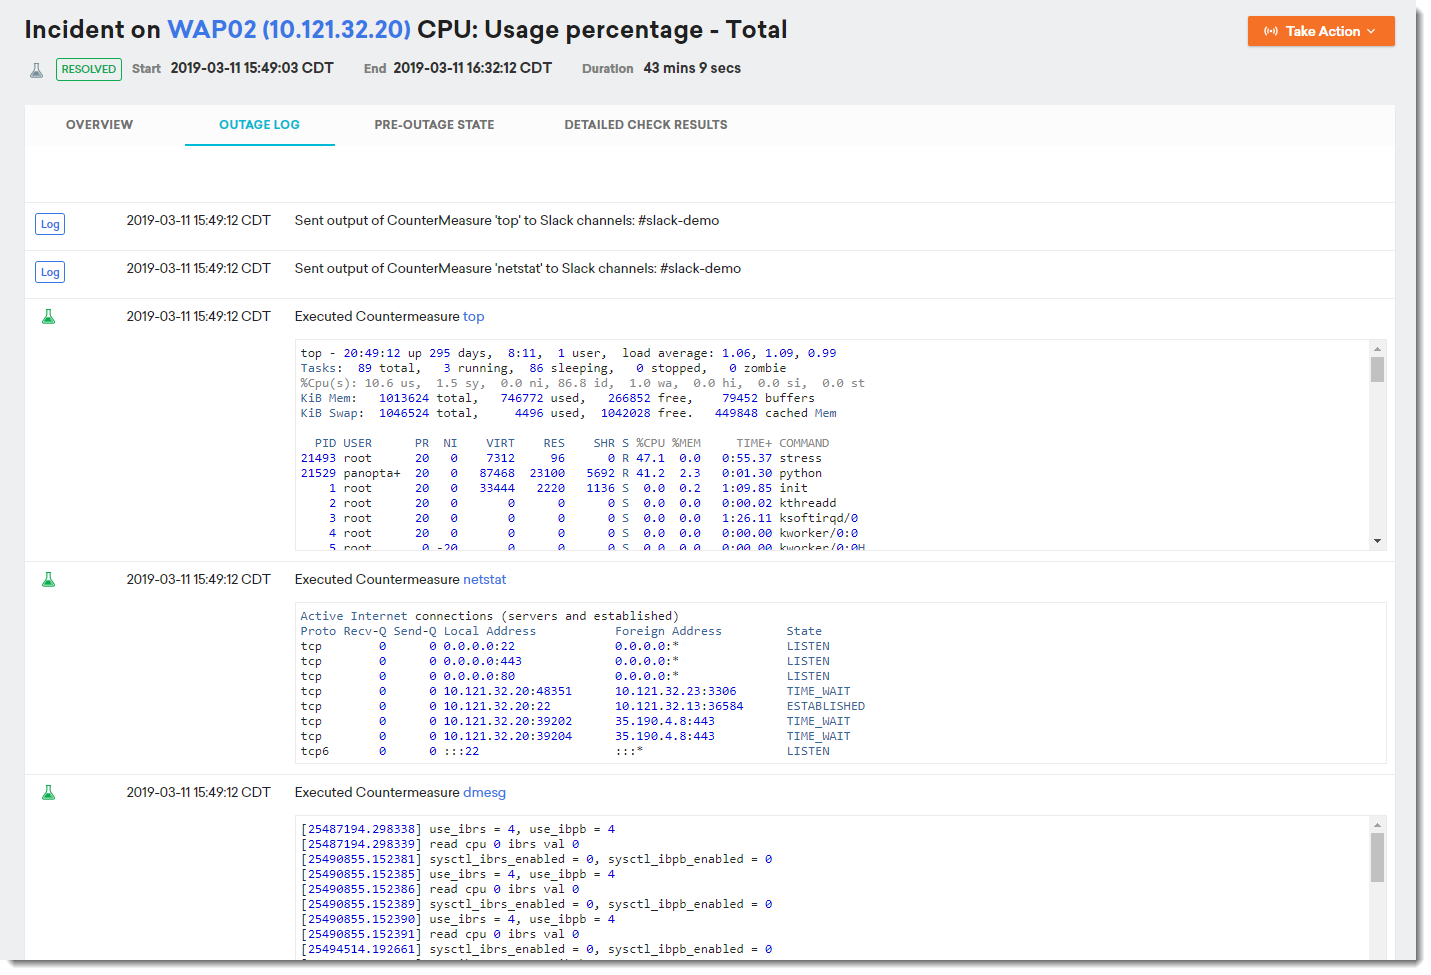
See Viewing CounterMeasure output for more information.
Billing
Your account is only charged for CounterMeasures when they are actively configured on an instance. That is, only instances that have CounterMeasures configured on Alert Thresholds.