


Reports
Reports can either be run ad-hoc or on a regular basis to keep you up-to-date on the status of many aspects of your account. Available reports are detailed in the following sections. If there is a particular report you would like, please contact us.
Available reports
- Agent Status Report
- Availability Report
- Capacity Planning Report
- Incident Report
- Incident Metric Export Report
- Interface Utilization Report
- Tag Audit Report
- Tags & Attributes Report
- User Audit Report
- Instance Configuration Report
- Metric Export Report
- Metric Configuration Report
- SD-WAN Report
- Service Performance Report
- MTTR and MTTA Report
- Historical SLA Performance Report
- User Incident Activity Report
Agent Status Report
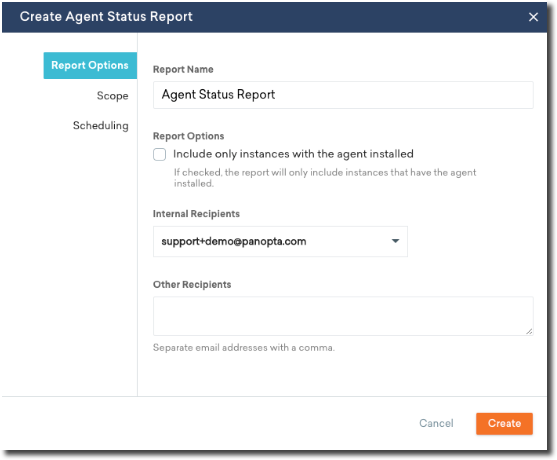
The Agent Status report allows you to query your infrastructure for the health and version of your agents. This is helpful for identifying inconsistencies as well as agents that require updates.
Each tab has multiple options, the first allowing you to select the recipients of the report, the second determines the scope, and the last allows you to choose the frequency of the report generation.
Availability Report
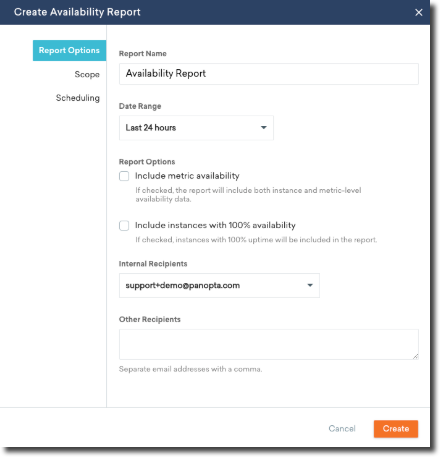
The Availability report gives you a full rundown of the current status of your infrastructure in FortiMonitor, based on a date range. You have additional report options, such as whether or not Server Agent metric availability will be included or if you want to see instances with 100% availability. Similar to the other reports, you have the option to dictate the scope based on group or by tag, and decide if the report should be recurring.
Capacity Planning Report
Our Capacity Planning report shows metric trends and usage to help you plan for the future and avoid hardware issues arising and affecting the customer experience.

The available variables are the date range, how to group the report, how you'd like the data aggregated, and who will receive this report. As with our other reports, you can choose the scope and schedule in the next tabs.
Incident Report
Our Incident report is pretty straightforward, you can see each of the incidents that occurred in your infrastructure over a selected period of time.

You can also decide if you'd like to report based on scope of incidents, severity, and current status.
Incident Metric Export Report
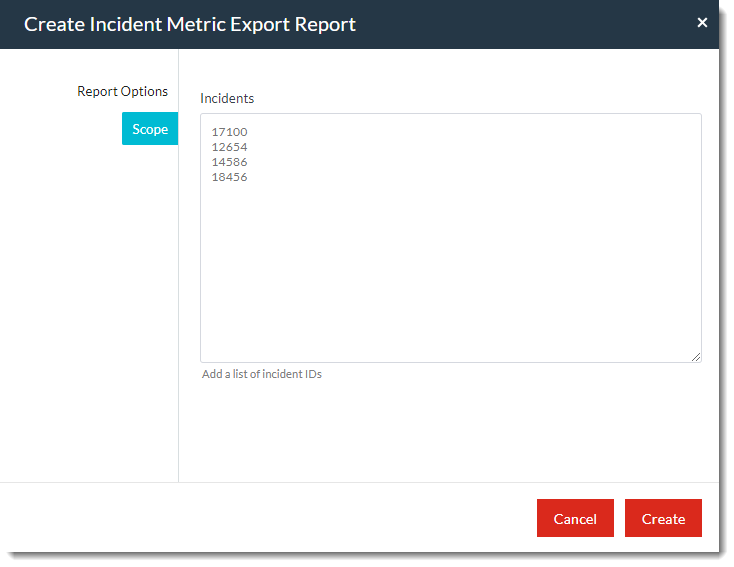
The Incident Metric Export report allows you to generate a report for one or more incidents that include detailed metric values for the duration of the incident. Enter the Incident IDs of the incidents that you want to include in the report in the Incidents field of the Scope tab.
Tag Audit Report
The Tag Audit report allows you to see which tags are in use, and to whom and what they are applied.
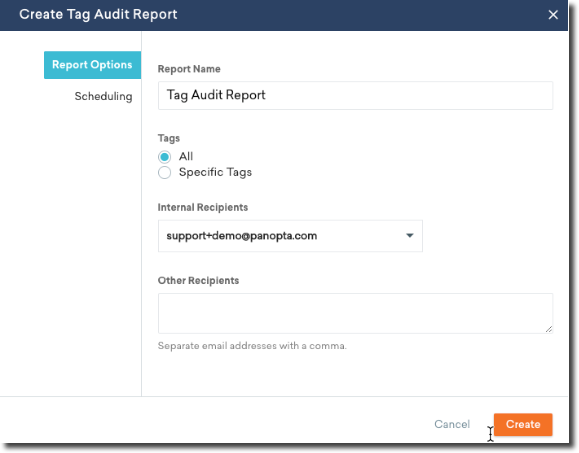
You have the option to see all tags, or query by specific tags.
Tags & Attributes Report
The Tags & Attributes Report shows you a breakdown of all the Tags and Attributes values across a selected scope. You can determine the scope by filtering by Instance, Group, or by Tag, and also schedule the report to run on a one time or recurring basis.

You can determine the scope and filter by Instance, Group, or by Tag, and also schedule the report to run on a one time or recurring basis.
User Audit Report
The User Audit report shows you who is an active user and what permissions they have. You can also see whether or not they have the mobile app installed, and the last time they logged in. The report also includes the Non-SSO Login column which shows whether a user can log in via SSO or not.
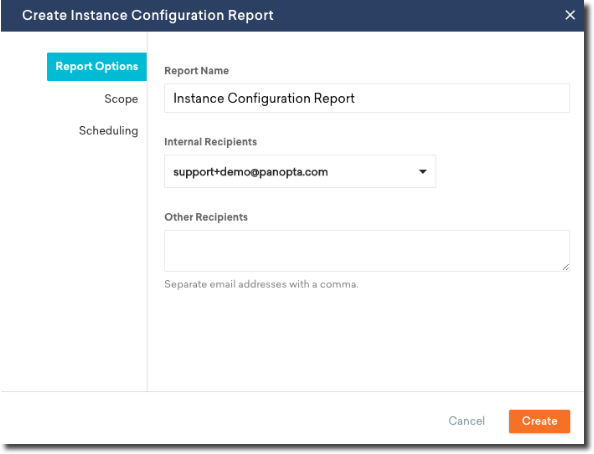
Instance Configuration Report
The Instance Configuration Report gives you the ability to export the current monitoring on a determined group of servers.

You can determine the scope and filter by Group or by Tag, and also schedule the report to run on a one time or recurring basis. The report returned gives you an overview of the selected servers, including information like Name, FQDN's, Group, Primary monitoring location, Alert Timeline, Tags, Templates, and any attributes.
Interface Utilization Report
The Interface Utilization Report provides a detailed view of interface metrics such as bandwidth, errors, and packets.

You can determine the scope and filter by Instance, Group, or by Tag, and also schedule the report to run on a one time or recurring basis.
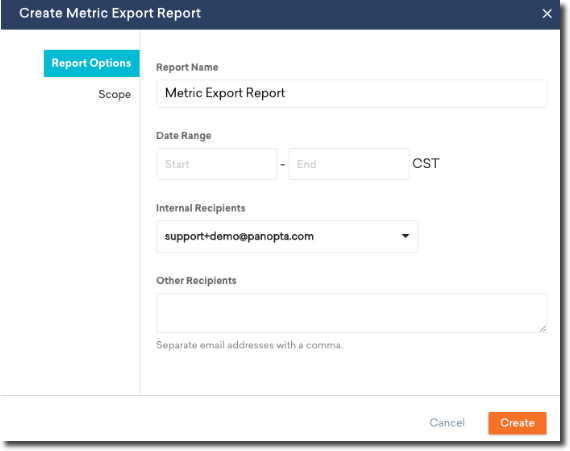
Metric Export Report
This report contains the data details for each metric running in your FortiMonitor account. The report gives you the option to select a date range for the given values and also determine to whom it will be sent. You can limit the scope of the export in the second tab.
Metric Configuration Report
The Metric Configuration report is similar to the Instance configuration report but only reports the metrics. The configuration difference between the two is that under scope you have an additional option to choose to filter the metrics by tag, metric type, report on only network service metrics, or only agent metrics.

This report is much more detailed than the Instance Configuration report, giving you information like Instance, Metric, assigned Alert timeline, monitoring location of each check, frequency of the check, the current status, and any applicable tags. There are also two separate tabs, one for Network Service Metrics, and the other for Server Metrics.
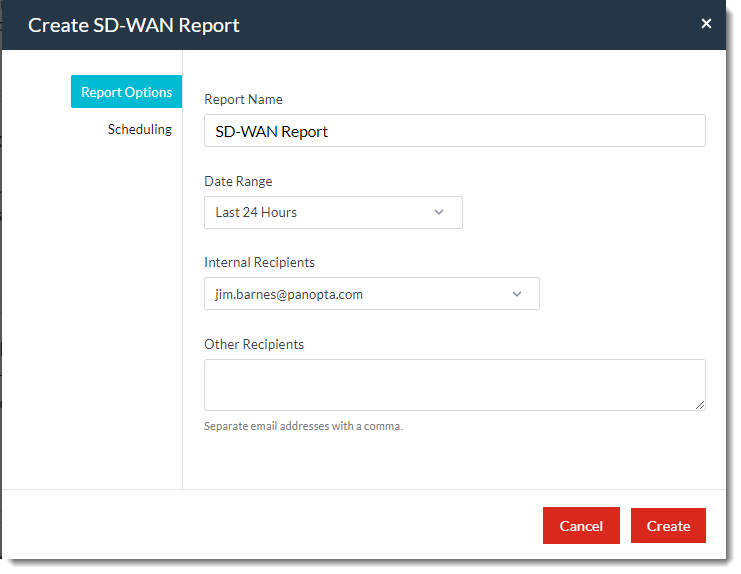
SD-WAN Report
The SD-WAN report provides a detailed view of your SD-WAN metrics.
Service Performance Report
The Service Performance report is similar to the Availability Report, but allows you to view the Availability in a cross-tab format, with metrics on the y-axis and instances on the x-axis.
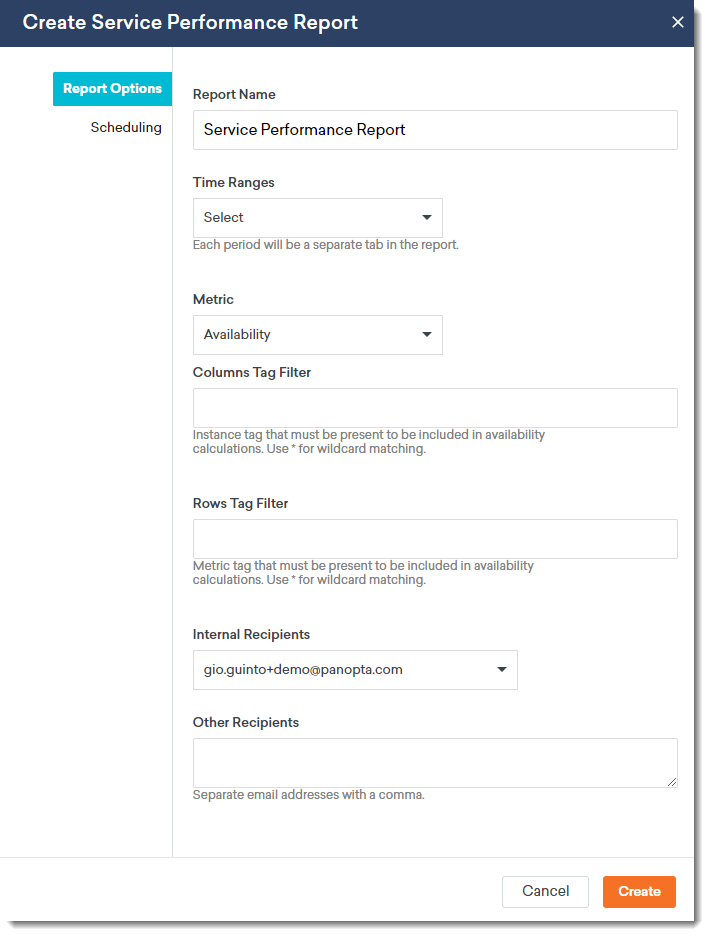
Each row/column is determined by tags, using a basic pattern matching syntax. For example, you tag your instances based on their location: "US-East", "US-West", and "US-North". You can use the pattern "US-*" to generate a column for each. If your metric tag syntax is based on the check location, like "Uptime-Fresno", "Uptime-Chicago", and "Uptime-DC", you can use the "Uptime-*" pattern to generate a row for each. This will result in a 3x3 table, with the average availability of the cross-section in each cell. If more than one instance or metric matches each tag, the average will be used.
You can generate the availability, total downtime, or average downtime.
MTTR and MTTA Report
The Mean Time to Resolution (MTTR) and Mean Time to Acknowledge (MTTA) report provides two metrics that measure the average elapsed time from when an incident occurs until the incident is resolved or acknowledged. The MTTA is the average elapsed time incidents are acknowledged after its occurrence. MTTR tracks the average resolution time of incidents.

Similar to other reports, you can also determine the scope and filter by Group or by Tag, and also schedule the report to run on a one time or recurring basis.
Historical SLA Performance Report
The Historical SLA Performance report provides the historical availability (in percent) of instances in your infrastructure. The report gives you the option to select instances, a date range from the given values (previous month, monthly, quarterly), and whether to run the report one time or on a recurring basis.

The report returned gives you the monthly or quarterly average availability of each selected instance.
User Incident Activity Report
The User Incident Activity report provides the following information:
-
The number of incidents a user is alerted on
-
The total alerts received by a user
-
The number of incidents acknowledged by a user
-
The number of incidents escalated by a user

Similar to other reports, you can also configure the scope, date range, and whether to run the report one time or on a recurring basis.