


Tags
Tags provide a dynamic method for you to query your infrastructure. You can create any number of tags to capture things like:
-
Environment
-
Server type
-
Application type
-
Responsible team
-
Other internal classification
Tags can be applied to several segments of your infrastructure:
-
Instances (physical servers, VMs, cloud instances)
-
Individual metrics
-
Agent and OnSight heartbeats
-
Network device ports
-
Users and dashboards
These are detailed in Apply tags.
You can manage and view all of your tags by going to the Tags page. For more information, see Manage and view tags.
Using tags
Limit access to dashboards
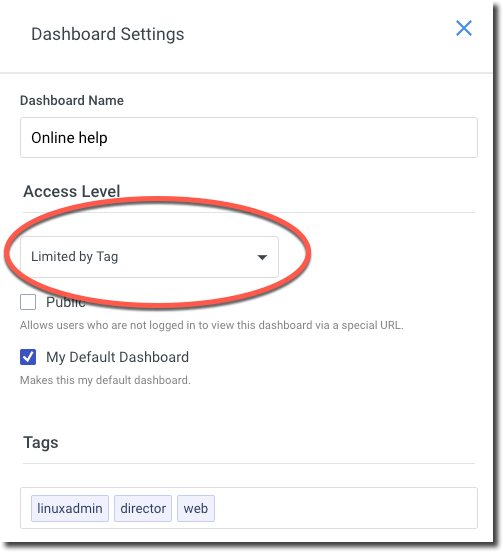
The Access Level options allow you to limit which of your users can see specific dashboards. If you select the Limited by tag option, dashboard access will be limited by which tags are set on this dashboard and tags set on a user. The tag filter uses OR logic when matching dashboard tags and user tags.
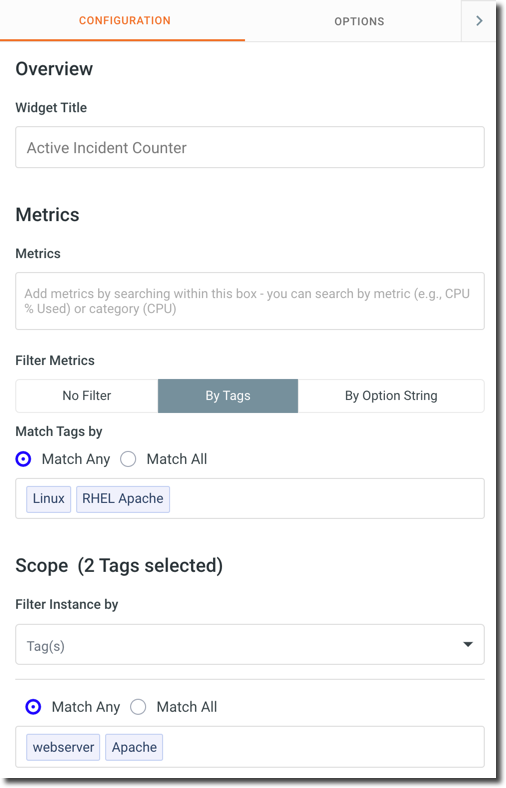
Dashboard widget filtering
Every widget provides options for dynamically displaying the appropriate infrastructure and metrics by tag, rather than hard-coded selections. This allows your infrastructure to expand and contract as needed without requiring constant changes on what is being shown in your live dashboards.
Infrastructure Map – Cluster by tag
Clustering by tag groups instances by the tags applied to each instance. Each tag you select from the Select Tags to Cluster by dropdown menu will become its own cluster.

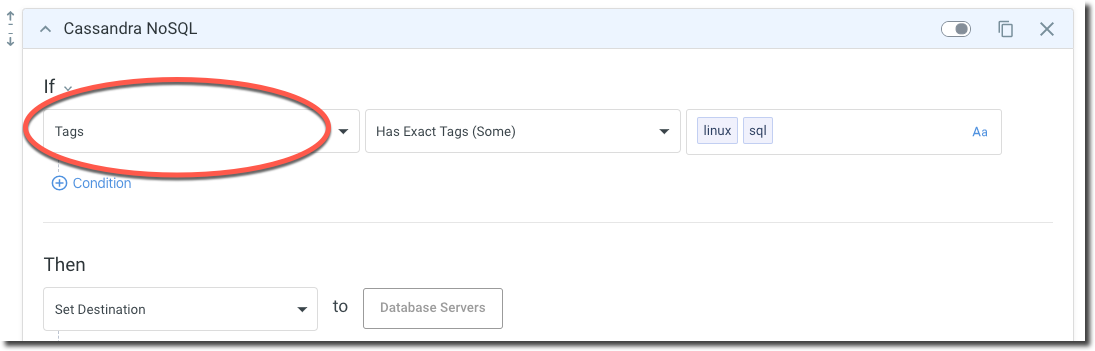
Monitoring policies
Using tags as a filterable dimension in Monitoring policies allows you to set tags as a condition in a ruleset. For example, based on the following screenshot, if an instance added to Panopta has the Linux and SQL tags, the instance will be added to the Database Servers group. For more details on how to use tags in monitoring policies, see Tag matching logic.
You can also use monitoring policies to apply tags to an instance.
Network device ports
This is helpful when you want to isolate and modify ports based on their function. For example, filtering ports with an HTTP tag will allow you to see only the ports associated with the tag. To tag network device ports, see Tag a network device port.