


Instance Details page
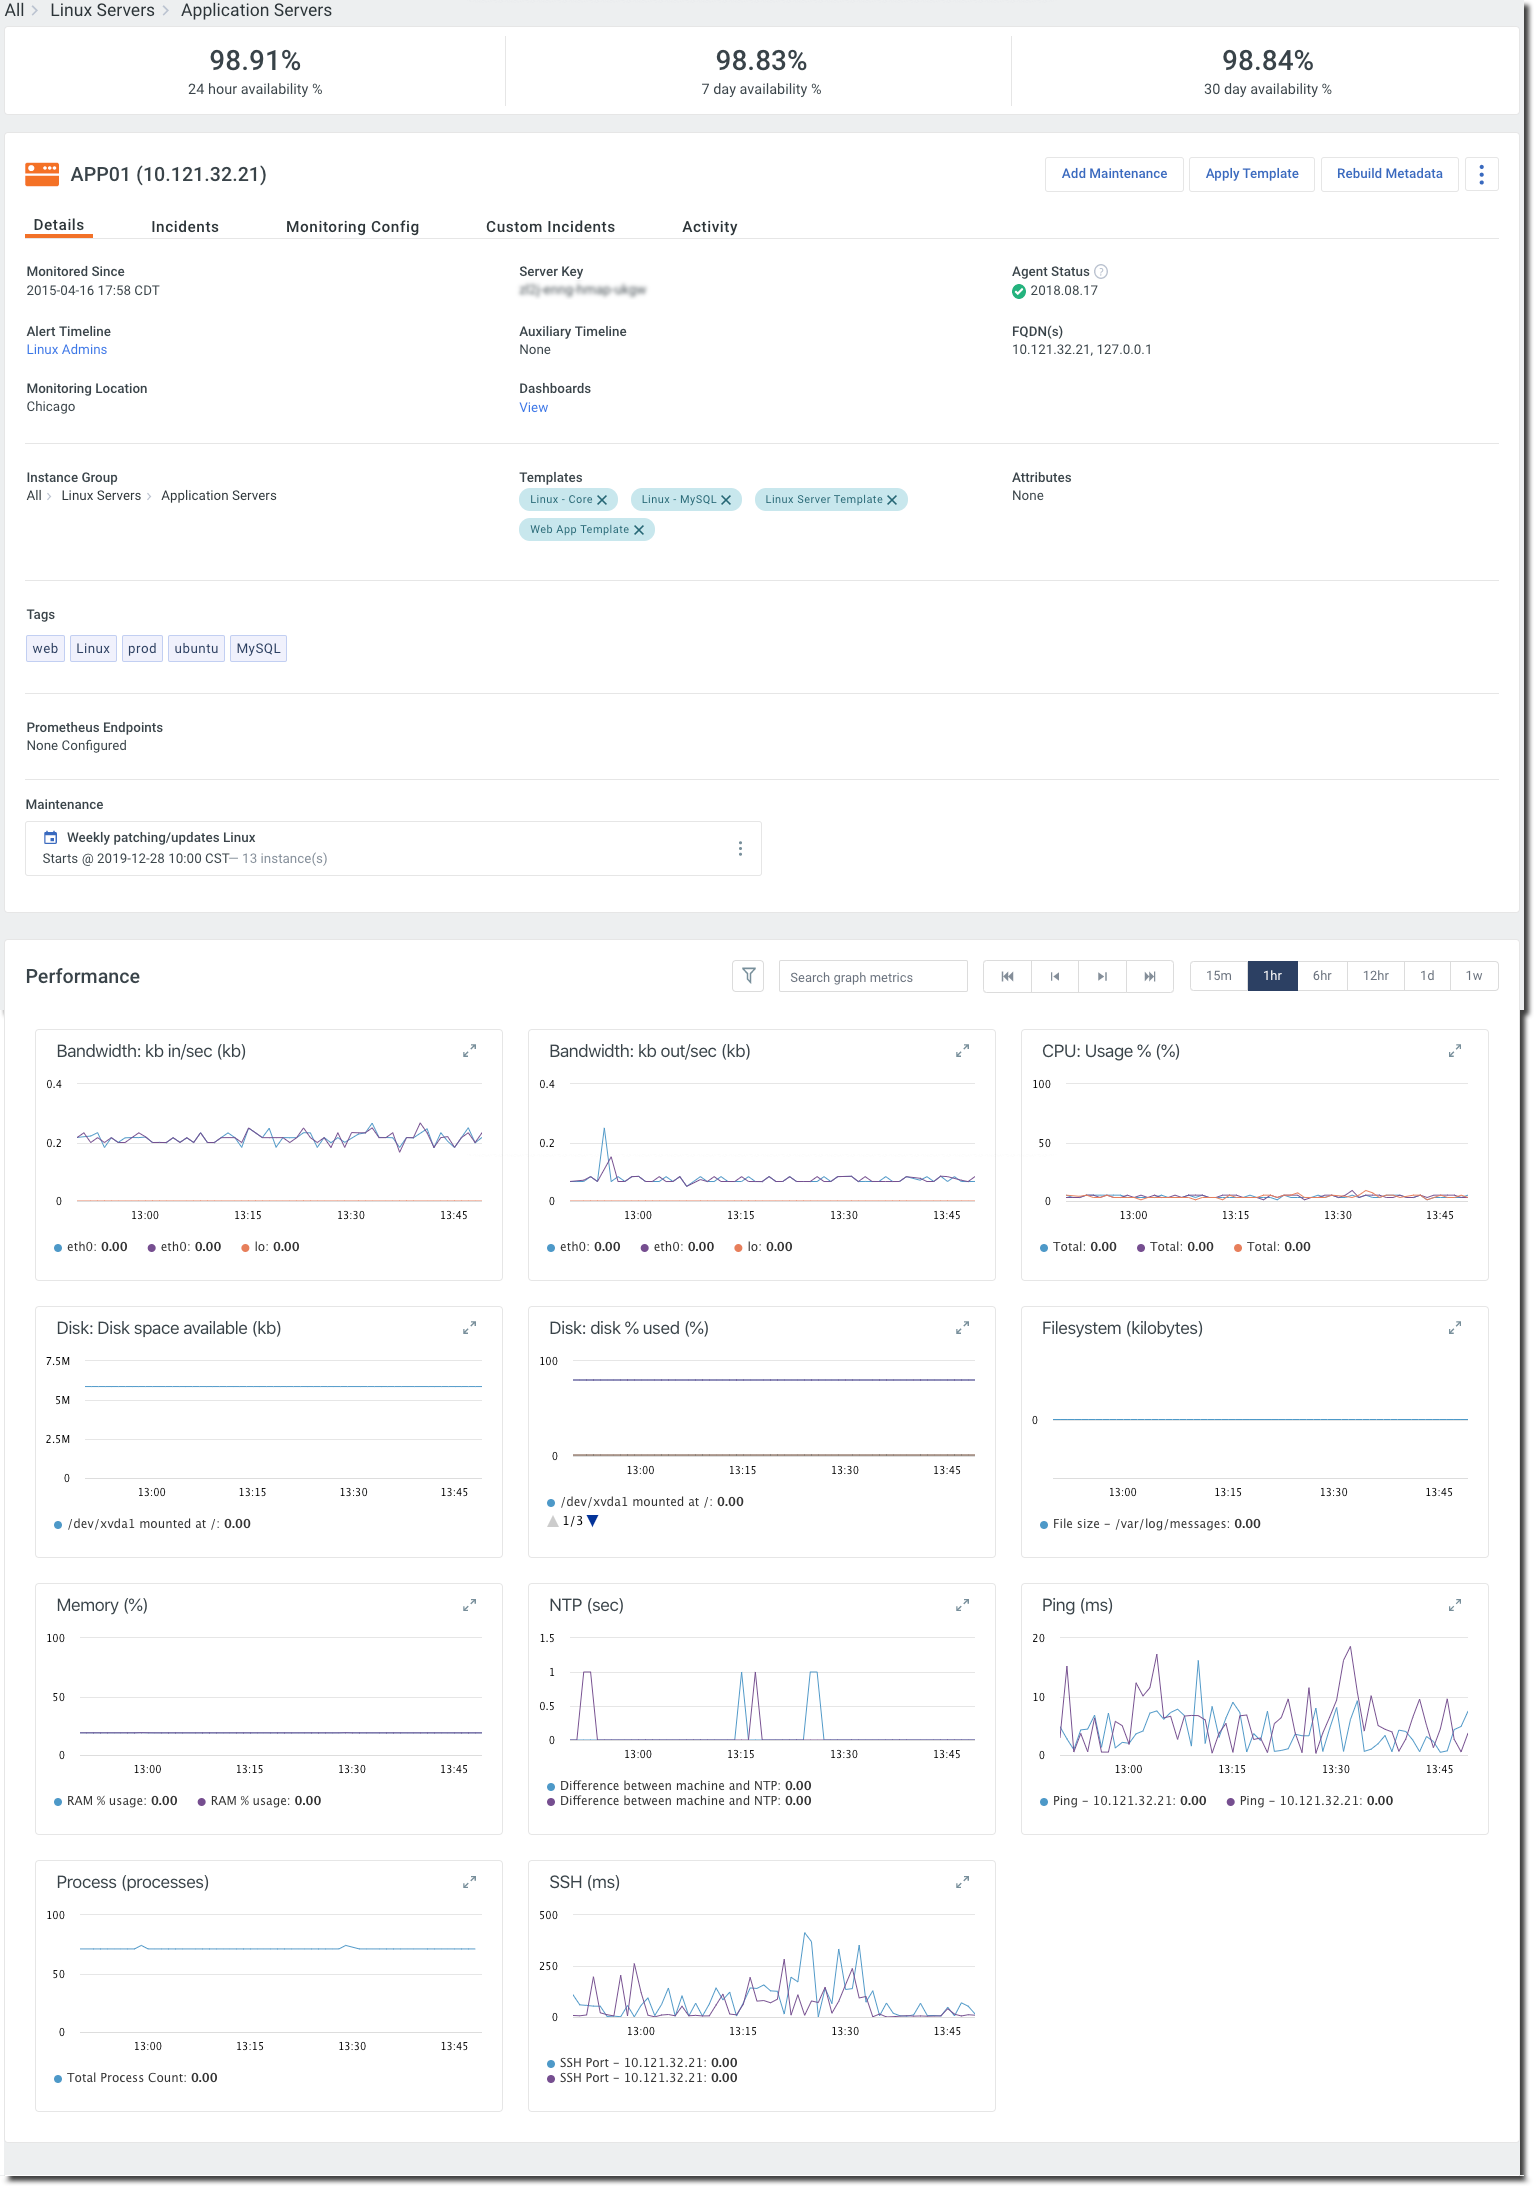
The Instance Details page exposes all of the relevant information about the instance, including the instance performance, monitoring configuration, incidents, maintenance schedules, availability, and more. The Instance Details page supports several actions to manage the instance metrics, maintenance, and if installed, the FortiMonitor Agent and CounterMeasures. Performance-based graphs are displayed in the Performance section of the Instance Details page to help you visualize the status of each metric configured for the instance.
The Instance Details page
The Instance Details page is divided into several sections and tabs. Go through the following sections to learn more.
Availability
The Availability section shows the availability of the instance in a 24-hour, 7-day, or 30-day time range.

Actions
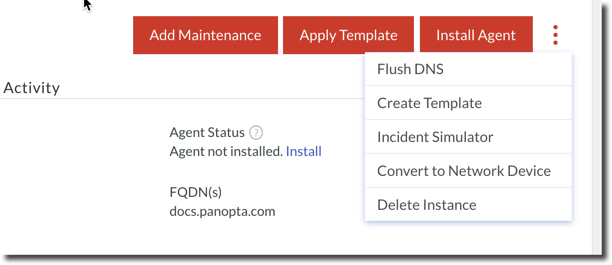
This section lists all of the actions that you can perform from the Instance Details page. Note that depending on the type of instance, some actions may not be available. Select the 3-dot icon to see the full list of actions available to the instance.
-
Add Maintenance– Create a maintenance period for this instance.
-
Apply Template – Apply a template to this instance.
-
Install Agent– Install the FortiMonitor Agent to this instance.
-
Rebuild Metadata – Rebuild the metadata to manually rescan your infrastructure for new instances.
-
Reinstall Agent – Reinstalls the FortiMonitor Agent.
-
Remove Agent – Uninstall the FortiMonitor Agent from the instance.
-
View Metadata – View the instance’s discovered metadata.
-
Flush DNS– Forces a DNS update after an IP address change.
-
Outage Simulator – Simulate an outage.
-
Delete Instance – Select the Delete Instance button to remove the instance from FortiMonitor.
-
Request Port Scan – Available only for network devices. Select Request Port Scan to initiate port discovery
-
Convert to Network Device – Available only for instances monitored by an OnSight vCollector. This action allows you to change the instance type to Network Device and assign a new or existing SNMP credential to the instance.
Sections
-
Active incidents
-
Details tab
-
Incidents tab
-
Monitoring configuration tab
-
Activity tab
-
Performance
Active incidents
Active incidents are displayed on top of the Instance Details page. Selecting an incident will open the incident's details page. From there, you can Respond to an incident and delay further alerts.

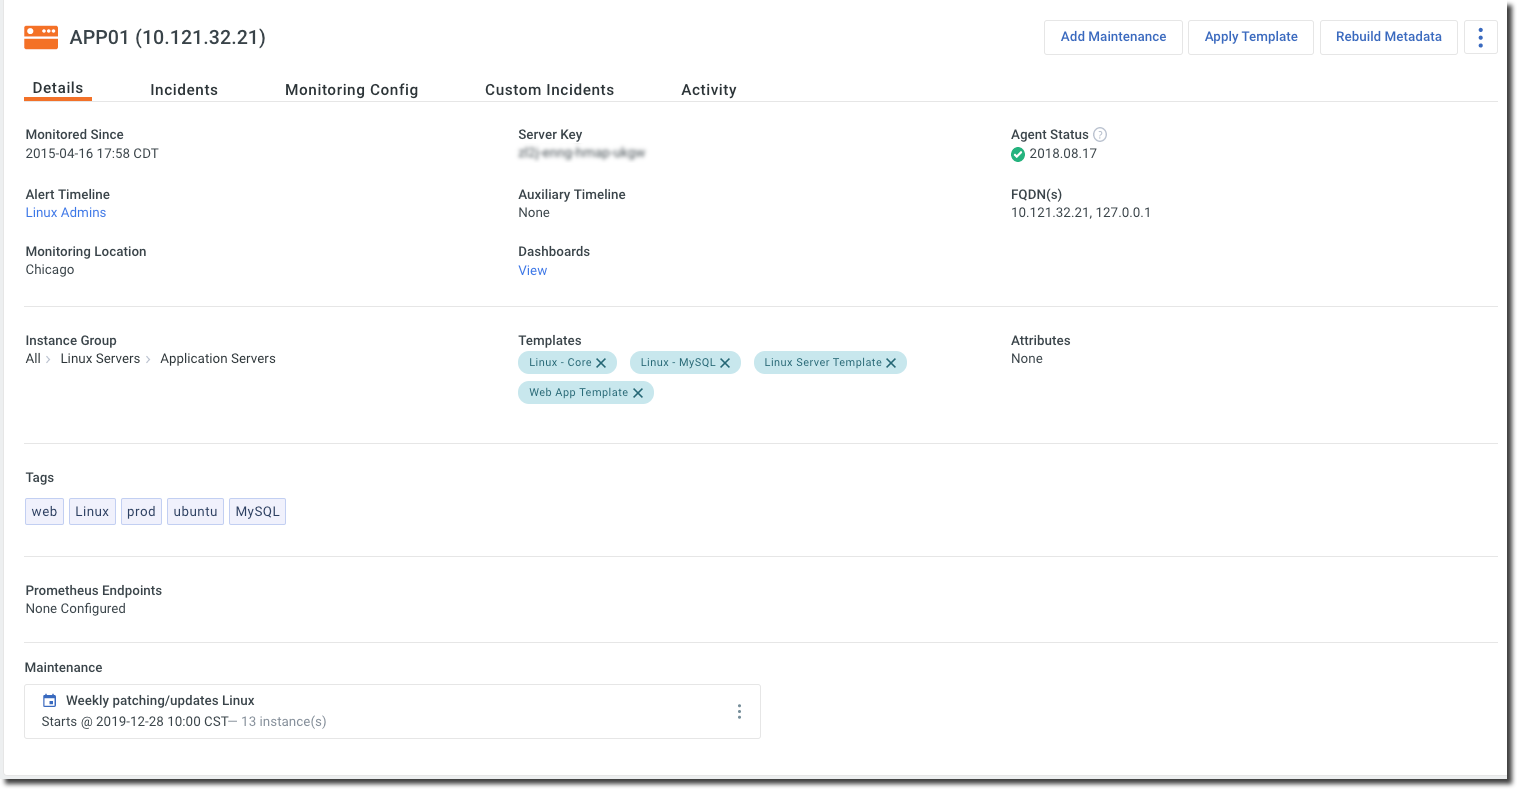
Details tab
The Details tab shows all of the information about the instance. Each field is described below.
-
Server Key – Unique identifier assigned by FortiMonitor to the instance.
-
Agent Status – The status of the FortiMonitor Agent, including the Agent's version, last sync, heartbeat alerts, CounterMeasures status, and last metadata build.
-
Alert Timeline – The Alert Timeline associated with this instance.
-
FQDN(s) – FQDN(s) associated with this instance.
-
Monitoring Location – The public checker or OnSight vCollector used to monitor this instance.
-
Auxiliary Timeline – The auxiliary Alert Timeline associated with this instance.
-
Instance Location - Location entered in this field is used in Geomap widgets. Latitude and longitude are entered in degrees, with + values corresponding to north latitude and east longitude, and - values corresponding to south latitude and west longitude.
-
Dashboards – Select View to display links to the dashboards associated with this instance.
-
Instance Group – The group where this instance belongs to.
-
Templates – The templates applied to this instance.
-
Tags – The tags applied to this instance.
-
Prometheus Endpoints – If you are using Prometheus to monitor your instances, add a Prometheus endpoint to incorporate the metrics to your FortiMonitor infrastructure.
-
Maintenance – Scheduled maintenance for this instance.
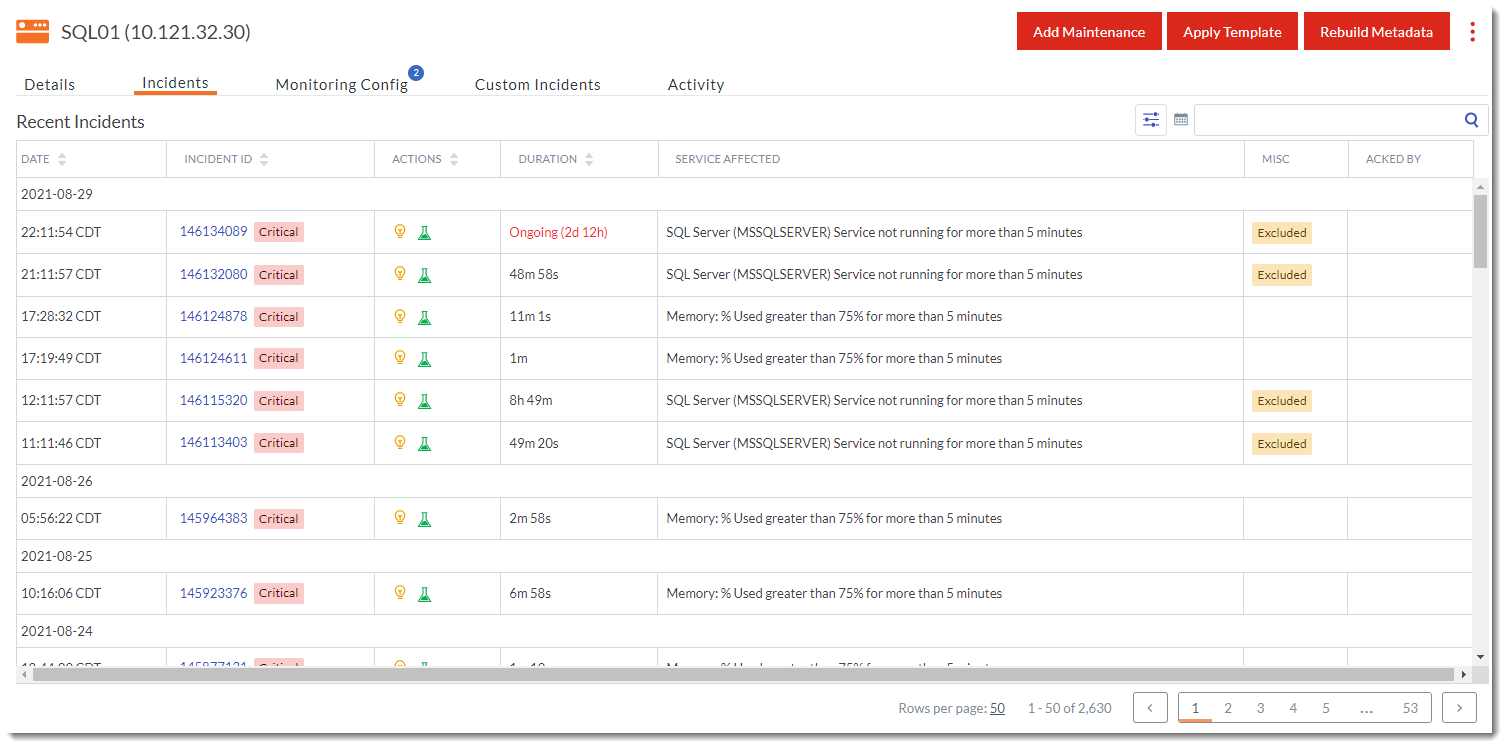
Incidents tab
The Incidents tab shows you a summary of all the incidents, whether active or resolved, for this instance. You can filter the list of incidents by selecting a severity type and by setting a time range.
Monitoring configuration tab
The Monitoring configuration tab shows all of the metrics configured for this instance. You can add monitoring and configure metrics from thistab.

Activity tab
The Activity tab provides a log of all actions performed on the instance. The initiator of the action, the date, and the action performed are detailed in the Activity Log table.

Performance
The Performance section provides a visual representation of the status of the instance. Each metric is represented by a line graph that can be filtered based on the metric type and scoped using a specific time range.
