


SNMP
SNMP is an effective way to monitor the health of network devices that you cannot monitor with an Agent. Our OnSight vCollector enables you to collect SNMP metrics in your account alongside your other monitoring like server health, application metrics, and network uptime, and availability.
Create an SNMP credential
To create an SNMP credential, perform the following steps:
-
Select Monitoring > Infra Settings > SNMP Credentials from the main navigation header.
-
On the Credential Management page, select + Add SNMP Credential.

There are a few different variables to fill in, such as the SNMP Label, which is the user-friendly reference to the credential. You’ll use this when you are adding the credential to devices in the FortiMonitor control panel. You also have to choose the SNMP version. FortiMonitor supports SNMP v1, v2c, and v3.

The fields are described in the following table.
|
Field |
Description |
Version 1 and 2c |
Version 3 |
|---|---|---|---|
|
SNMP label |
Enter a name for this SNMP credential. |
✔ |
✔ |
|
SNMP version |
Select the SNMP version for this credential. Values:
|
✔ |
✔ |
|
SNMP port |
Enter the UDP port your SNMP server is listening to. Default: 161 |
✔ |
✔ |
|
SNMP community |
Enter the SNMP community string for this SNMP credential. |
✔ |
|
|
SNMPv3 User |
Enter the associated SNMP user name. |
✔ |
|
|
SNMPv3 Authentication Algorithm |
Select the authentication type to use for this SNMP credential. Values:
|
|
✔ |
|
SNMPv3 Authentication Key |
Enter the key to be used for user authentication. The key is the encrypted version of a cleartext password |
|
✔ |
|
SNMPv3 Encryption Algorithm |
Select the encryption algorithm to use for this SNMP credential. Values:
|
|
✔ |
|
SNMPv3 Encryption Key |
Enter the key associated with your selected encryption algorithm. |
✔ |
3. Once the SNMP credential is set up, you have to import your network devices. There are two main ways to accomplish this; manually and with OnSight Discovery. If you want to use OnSight discovery or the devices are already in FortiMonitor, you can skip this section.
View the list of devices associated with an SNMP credential
You can view a list of devices associated with a credential by clicking on the number of devices using the credential.

Configure the network device
To configure a network device, perform the following steps:
-
Go to the Instance Details page of the network device that you want to configure.
-
Select the name of the network device or the Edit icon.
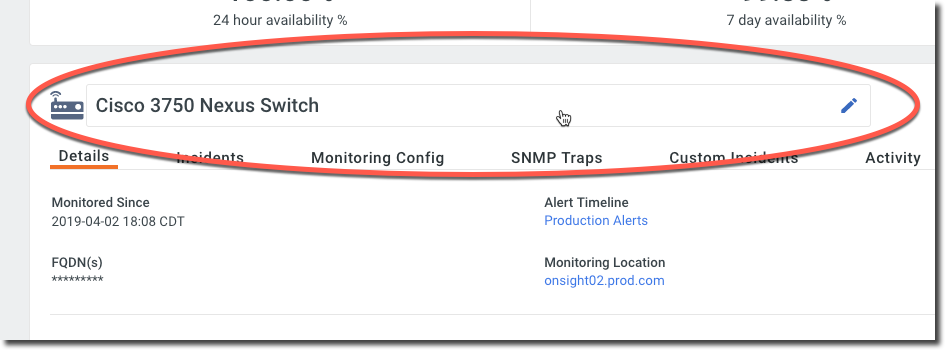
The OnSight Configuration drawer will slide out.
-
Edit the following settings as needed:
|
Option |
Description |
|---|---|
|
General |
|
|
Name |
Change the name of the network device. |
|
Server Key |
The unique key used to reference this device. |
|
Instance Group |
Select an instance group for the network device. |
|
Tags |
Enter tags that can help define the network device. For example network, cisco. Press Enter after each tag. Known tags will be auto-suggested to you. Tags should not contain spaces. |
|
Attributes |
Add key-value pairs that can provide more structure to your instance metadata. |
|
FQDNs and IPs |
Add additional interface names. See Additional IP addresses or FQDNs. |
|
Description |
Enter a description for the template. |
|
Parent Instance |
(Optional) The device upstream from this server that it depends on. If the parent device experiences an outage, this server's outage notifications will be suppressed. |
|
Prometheus Endpoints |
Add a Prometheus endpoint to the network device. |
|
SNMP Credentials |
Add an SNMP credential to the template. |
|
Select Credentials |
The SNMP credential used for this device. |
|
Recurring SNMP Discovery |
Enable this option if you want the OnSight to regularly scan the network device. Detected metrics will automatically be provisioned. |
|
SNMP Scan Frequency |
This option only appears when the Recurring SNMP Discovery option is enabled. Specify how often (minutes) the network device is scanned for new metrics. |
|
Port Metric Provisioning |
Enable this option to auto-provision SNMP metrics. |
4. Select Save Changes.
Monitor metric performance
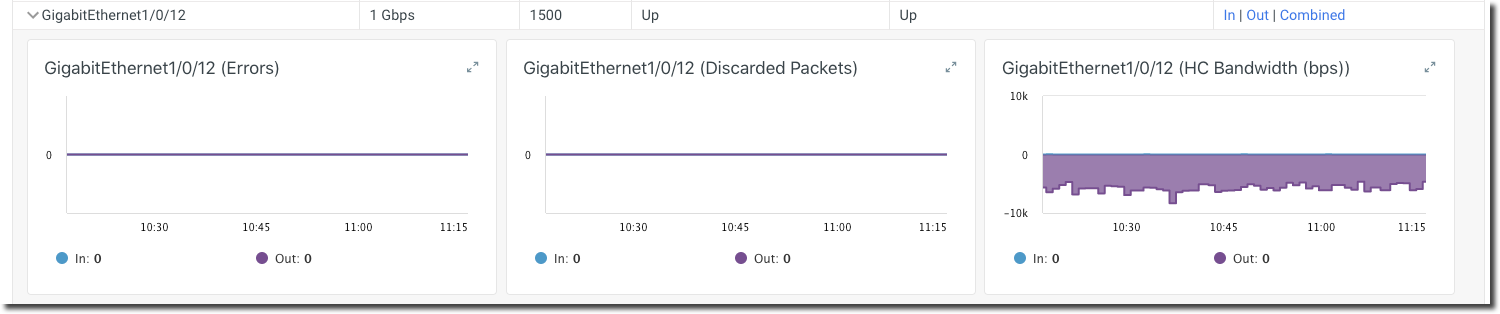
In the Performance section of the network device's Instance Details page, each metric is presented differently. Device-level metrics use performance line charts along the top.

Port/interface-level metrics use a customized roll up display which shows interface stats in expandable rows.

Click on a specific row to expose all interface-specific performance and health metrics. The graphs will show both inbound/outbound stats stacked on the same graph with zooming ability. Click on the expand icon in the upper right-hand corner of a graph to see a fullscreen display.
Using templates allows you to standardize your thresholds set and alerts and implement them across similar devices.
SNMP vendor documentation
The following is a list of some of the supported SNMP vendors and links to their respective SNMP configuration help pages.