


Kubernetes Details page
Select the Kubernetes cluster from the Instance tree to view the Kubernetes details page.

Each of the sections on this page are described in detail in the following sections:
Kubernetes cluster
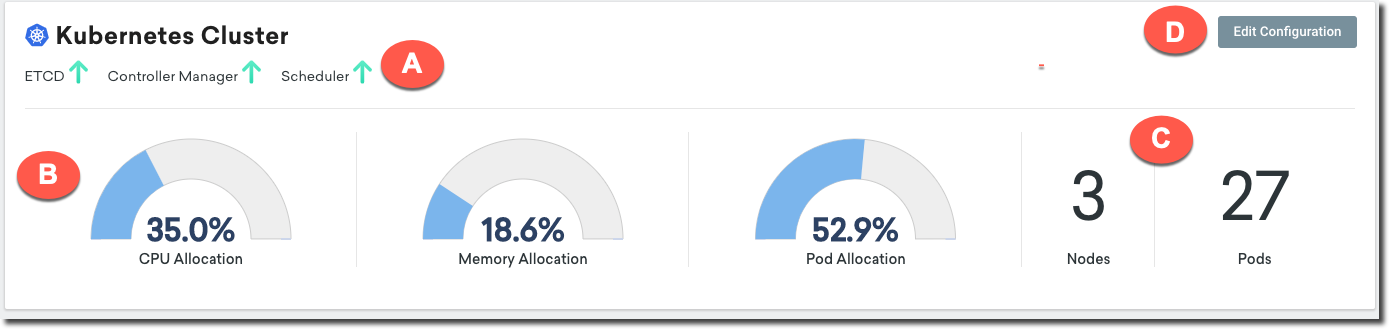
The Kubernetes cluster section of the details page shows the status of the components in the Kubernetes cluster. Gauges to measure resource allocation and the number of nodes and pods are also displayed. The section is described in the following table.
|
A |
Component status |
|
Shows the status (up or down) of the following Kubernetes components:
|
|
|
B |
Gauges |
|
The aggregated value of CPU, memory, and pods allocated to the cluster. |
|
|
C |
Nodes and Pods |
|
The total number of nodes and pods in the cluster. |
|
|
D |
Edit Configuration |
|
Select Edit Configuration to open the Cluster Configuration drawer. The drawer contains the following tabs:
|
Pod health
The Pod health section provides a high-level view of the health of the Kubernetes pods in your infrastructure. Pods are represented by green squares if there are no incident detected. Otherwise, the square becomes red.

You can hover your mouse to a pod to show the pod's details.

When you select a pod, a drawer detailing the pod's active incidents, containers, and performance metrics slides out.

Kubernetes infrastructure
The Kubernetes infrastructure section lists all the nodes, pods, and containers in your infrastructure. The section is described in the following table.

|
A |
Name |
|
When you click on the name, a Node or Pod Overview drawer slides out. You can also expand the list to show all of the pods under a node by selecting the node's expand arrow. Select the expand arrow on a pod to show all of the containers under that pod. |
|
|
B |
Type |
|
The type of the Kubernetes component (Node, Pod, Container). |
|
|
C |
Status |
|
A green up arrow is displayed if there are no incidents detected in any of the pods or containers under the node. If an incident is detected, a red down arrow is displayed. |
|
|
D |
Incidents |
|
The aggregated number of active incidents in this node, pod, or container. |
|
|
E |
CPU and memory allocation |
|
The line graph representation of the aggregated value of CPU and memory resources allocated to the node, pod, or container. |
Kubernetes services
The Kubernetes services page lists all of the services running in the Kubernetes cluster. The section is detailed in the following table.

|
A |
Services |
|
A service is a group of pods running on the cluster. |
|
|
B |
Selector |
|
The label selector used to define the service. |