Part 6: Reports
This article describes the different methods to pull data and create reports from FortiMonitor. The following options are available:
-
Canned reports
-
Scheduled reports
-
Ad-hoc reports
In addition, you can also download any previously generated report from the Report History page.
Canned reports
Canned reports are pre-configured reports that can be generated on-demand or on a recurring basis. Once a report is generated, it will be sent to the email address you selected while creating the report. You also have the option to add other FortiMonitor or external users as recipients to the report. Similarly, several configuration options are available when generating a canned report. For more information, see Canned reports.
The following table describes the available canned reports in FortiMonitor.
|
Report type |
Description |
|---|---|
|
Agent Status report |
Provides the status and current version of all the Agents in your infrastructure. This can help you identify any inconsistencies as well as Agents that require updates. |
|
Availability report |
Provides a full rundown of the current status of your infrastructure in FortiMonitor for a given time range. |
|
Capacity Planning report |
Provides metric trends and usage to help you with capacity planning. |
|
Incident report |
Shows you a detailed list of all the incidents that occurred in your infrastructure over a selected period of time. |
|
Tag Audit report |
Shows which tags are in use and where they are applied. |
|
User Audit report |
Shows a detailed list of all users and what permissions they have. The report also shows you which users are active, the last time they logged in, or whether or not they have the mobile app installed. |
|
Instance Configuration report |
Allows you to export the current monitoring setup on a determined group of instances. |
|
Metric Export report |
Shows the performance of each metric in your FortiMonitor account. |
|
Metric Configuration report |
The Metric Configuration report is similar to the Instance configuration report but only reports the metrics. The configuration difference between the two is that under Scope you have an additional option to choose to filter the metrics by tag, metric type, report on only network service metrics or only agent metrics. |
|
Service Performance report |
The Service Performance report is similar to the Availability Report but allows you to view the Availability in a cross-tab format, with metrics on the y-axis and instances on the x-axis. |
|
MTTR and MTTA Report |
The Mean Time to Resolve (MTTR) and Mean Time to Acknowledge (MTTA) report provides information on how long incidents are resolved and acknowledged after their occurrence. |
|
Historical SLA Performance Report |
Provides a monthly or quarterly breakdown of your infrastructure's performance. |
|
User Incident Activity report |
Shows each user's incident activity |
To create a canned report, see Create a report.
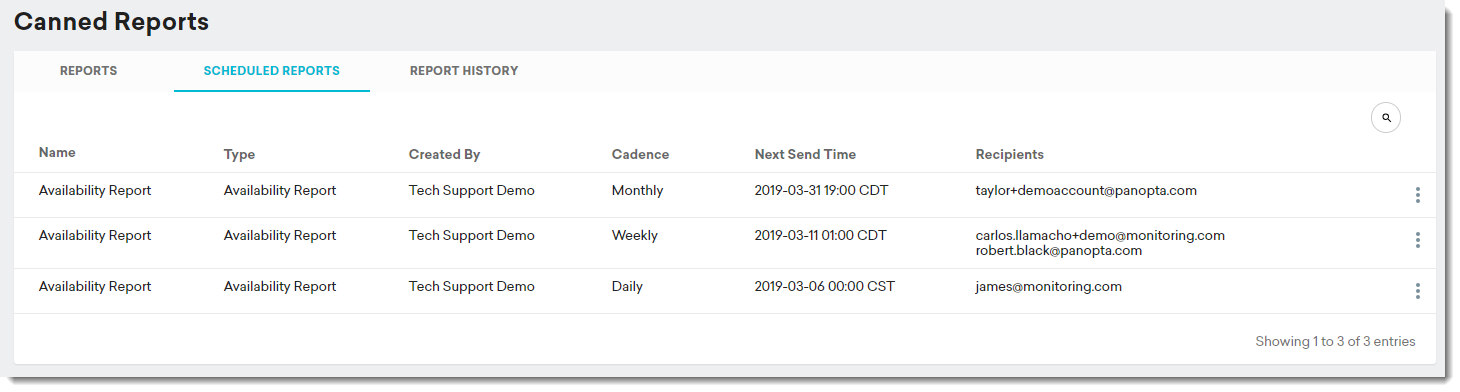
Scheduled reports
When creating any of the canned reports, you also have the option to create recurring or scheduled reports. You can view all of your recurring reports on the Canned Reports page under the Scheduled Reports tab.
There are several options available when creating a scheduled report, including recipients of the report, and the cadence or how often a report is generated. Similar to canned reports, the configuration options vary depending on the type of report you choose. To schedule a report, see Create a report.
Report history
The Report History tab displays all the previously generated reports for your infrastructure. You can download a copy of any of the reports by selecting Download.
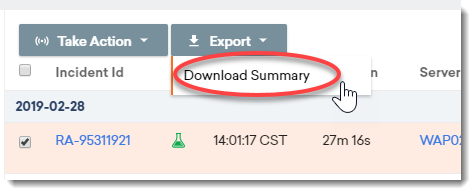
Ad-hoc reports
From the Incident History page, you can generate a report on any incident that occurred in your infrastructure. To do so, select one or more incidents then select Export > Download Summary. There are also several filters available to refine the list of incidents displayed on the page.