


Advanced monitoring and tuning
Adding Monitoring
Adding the additional enhanced monitoring can be done on the instance page itself.
On each instance page, under the monitoring tab (see below), checks and metrics which have been already added will appear under the light grey headers. Each grey header represents a different high level monitoring category. To add more monitoring within those existing categories, click on the grey “Add Metric” button to the right.
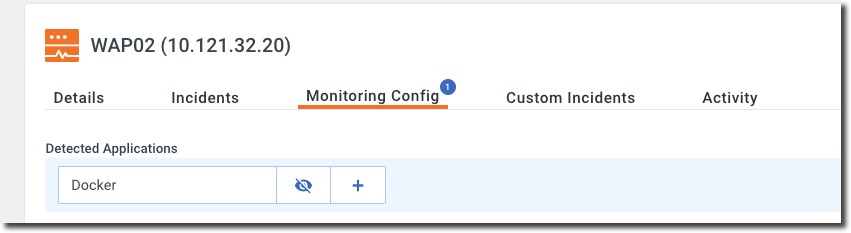
FortiMonitor also attempts to automatically discover other services and applications which are present on the server. Those discovered categories will appear under Detected Applications in the Monitoring Config tab of the Instance Details page and can be quickly added by selecting the + button.
To add other categories of monitoring, select the Add Monitoring button above the table. This will expose a catalog of different out of the box monitoring capabilities for application stacks on both the Windows and Linux platforms. Certain applications may require additional configuration to be auto-discovered and become operation. Specifics on each plugin configuration can be found here. For more information on creating your own custom monitoring metrics, see here.
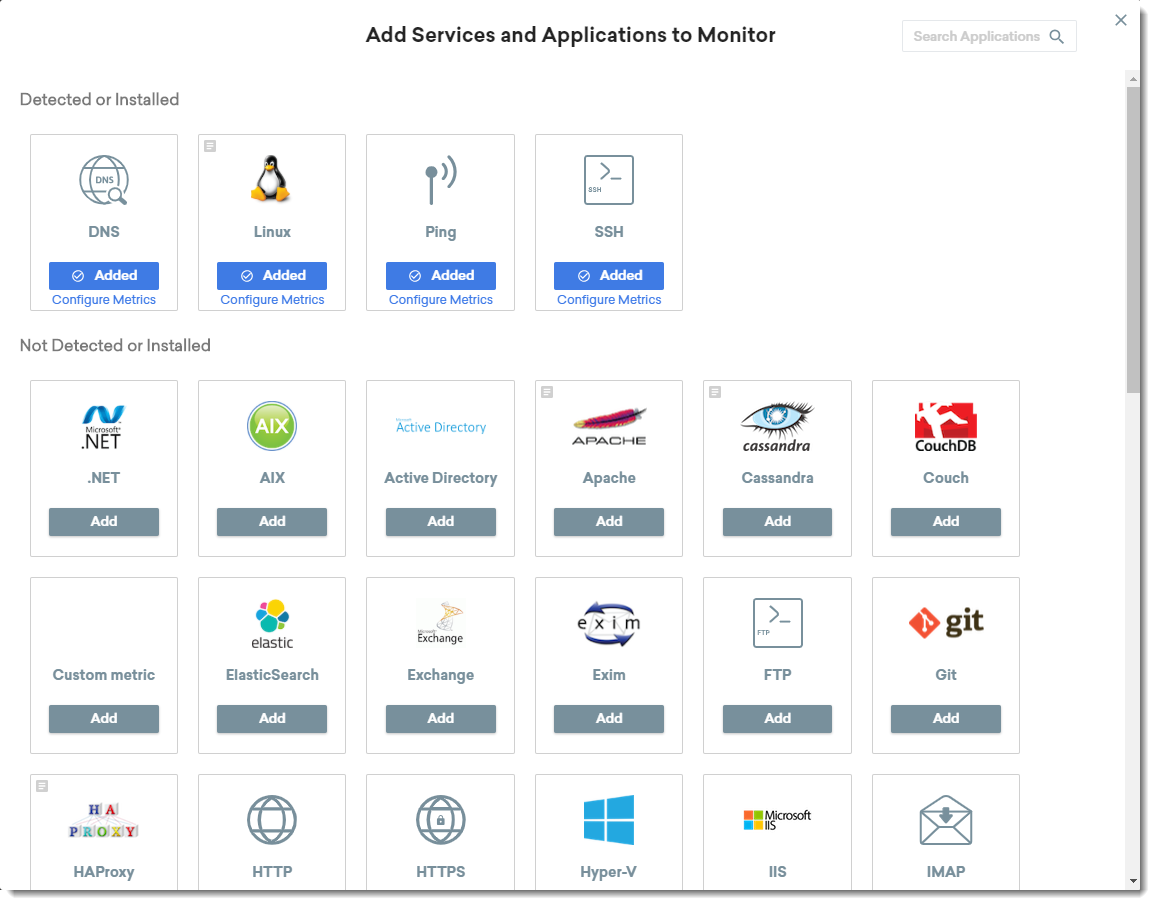
For detected metrics, you can click either the Add button, or the Configure Metrics button for already added checks.
Once you click the Monitor button on any of the discovered or selected categories, a drawer will slide out from the right offering you different types of checks and metrics. Here’s an example of what is shown when you select HTTPS.
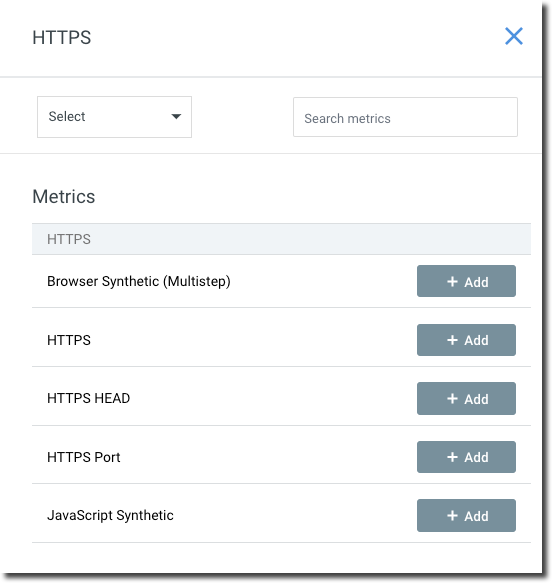
Choose from one of the check types by clicking + Add. Doing so will open a window presenting different configuration options. Let’s choose a standard HTTPS web check.

As you can see, there are a number of tabs for configuring the check, but not all of them are required. For HTTPS, there are options for authentication, simulating user requests, SSL/TLS verification and content matching.
In addition, there are additional options that will allow you to override auto-generated names and template settings:
-
Metric Name Override – Enter a metric name to override the auto-generated name. If provided, this will be used in metric configuration, graph legends, and alerts. Leave blank to use auto-generated metric names.
-
Prevent metric override – Prevent a metric from being updated by future template applications.
Applying a template to the instance will not override the current setting of the metric. For example, you applied a template which sets up SSH checks for Linux servers using default port 22 but you also have a few Linux servers that have SSH on a different port. After template application, you can update the metrics to use the correct port and enable the Prevent metric override option. By enabling this option, you ensure that the metric will not be move back to port 22 after subsequent template applications.
Within the Thresholds tab, you’ll have the option to choose a specific alert timeline if different from the server’s default alert timeline. This can be useful for sending different types of alerts to different teams or to tune the alerting aggressiveness of specific failures.
Adding Agent Metrics
Adding a metric which is monitored by the FortiMonitor Agent follows roughly the same steps. Here is an example of adding a disk space available check.

Under the Settings tab, select the appropriate options for the metric along with the frequency of collection. Then, set any number of thresholds on the Thresholds & CounterMeasures tab which can each use a different alert timeline for notification.
Tags
Adding infrastructure tags at this point is optional, however if you’d like to get started, tags can be set at the check level, as well as the server level. In this way, tags give you a flexible and powerful method to dynamically “query” your infrastructure within the different systems in FortiMonitor. Use tags to:
-
Have dashboard widgets dynamically show the right metrics and infrastructure
-
Run scheduled and ad-hoc reports across different segments of your infrastructure
-
Schedule maintenance windows for certain slices of your environment
Now that you have your base set-up for a few servers finished, the next step is automating the process using templates to make adding instances efficient and standardized.