


Quick status bar
You can quickly view the status of devices on the Managed Switches pane by using the quick status bar, which contains the following information:
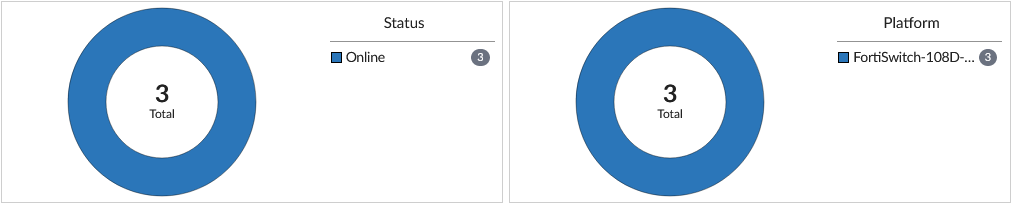
- Status Chart
- Platform Chart
Use the Show Charts dropdown and toggle to show or hide charts. From the dropdown, select or de-select the checkboxes for Status and Platform to show or hide the respective chart.
To use charts in the quick status bar:
- If using ADOMs, ensure that you are in the correct ADOM.
- Go to FortiSwitch Manager > Managed FortiSwitches. The quick status bar is displayed above the content pane.
- In the tree menu, select a FortiGate or Managed FortiGate. The devices for the group are displayed in the content pane, and the quick status bar updates.
- Mouse over the charts to see more information about the data in a tooltip.
- Click items in the legend to filter the devices displayed on the content pane. For example, if Offline is available in the legend, click Offline to display only devices that are currently offline.
You can click multiple items in the legend to apply multiple filters. A filter icon
 appears next to the chart title when it is being used to filter the Managed Switches pane.
 - To remove the filters, click the chart title with the filter icon.