


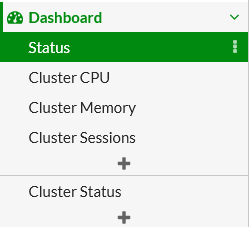
New default cluster dashboards
FortiGate-6000 and 7000 for FortiOS 6.4.2 includes new pre-configured cluster dashboards that show CPU use, memory use, number of sessions, and synchronization status for the FortiGate-6000 management board and individual FPCs or for all FortiGate-7000 FIMs and FPMs.
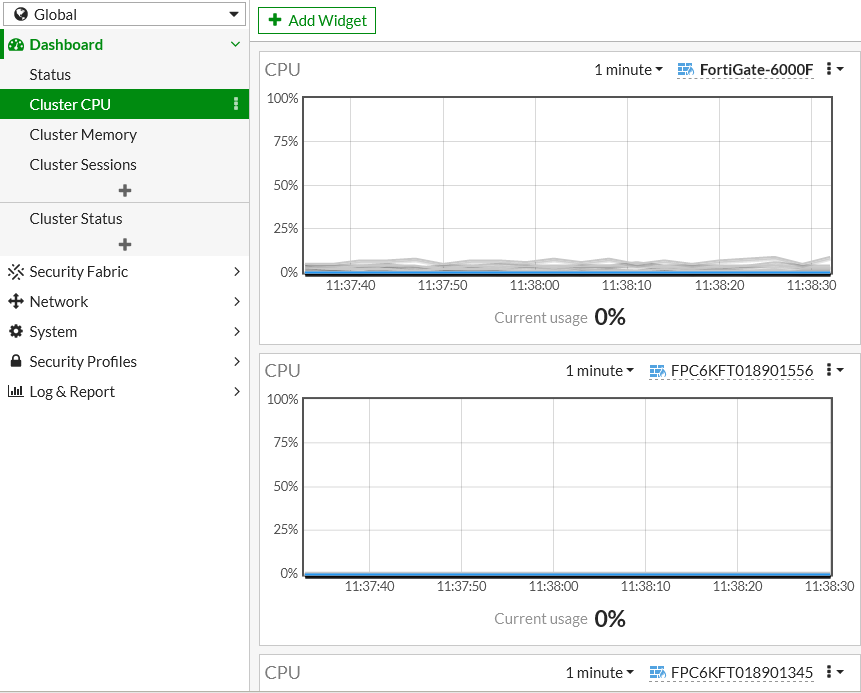
For example, for a FortiGate-6301F, the default Cluster CPU dashboard contains CPU usage widgets for the management board and for each FPC.
The Cluster Status dashboard is the FortiOS 6.4.2 location of the Configuration sync monitor (available on FortiGate-6000 or 7000 for FortiOS 6.2.x under Monitor > Configuration sync monitor).

If you make changes to your dashboard configuration and the default cluster status dashboards no longer appear, from the dashboad action menu you can select Reset all Dashboards to restore the default dashboard configuration.