Consolidated dashboard usability improvements 6.4.1
A What's New in FortiOS 6.4 video appears after upgrade to highlight new features such as Dashboard and Monitor usage. Two modes, Optimal and Comprehensive, were added to display different default monitors. Users can also easily add new Dashboards or Monitors directly from the menu.
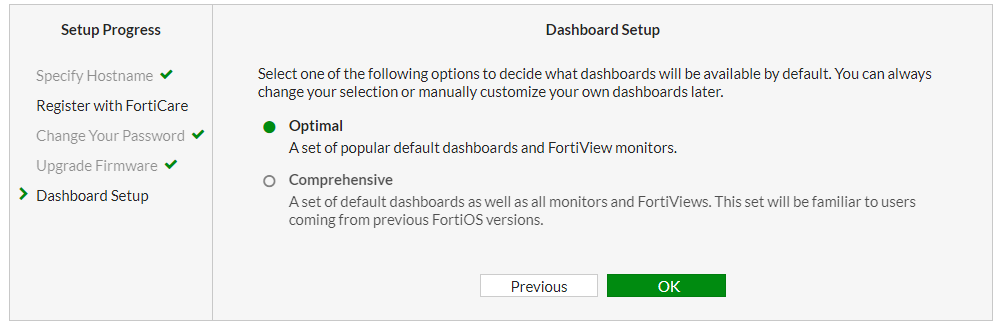
To select a dashboard template at log in:
- Log in to FortiGate. The Dashboard Setup option appears in the FortiGate Setup dialog.
- Click Begin.

- At the Dashboard Setup step, select Optimal or Comprehensive dashboard template.
The following dashboards and monitors are included in the default templates:
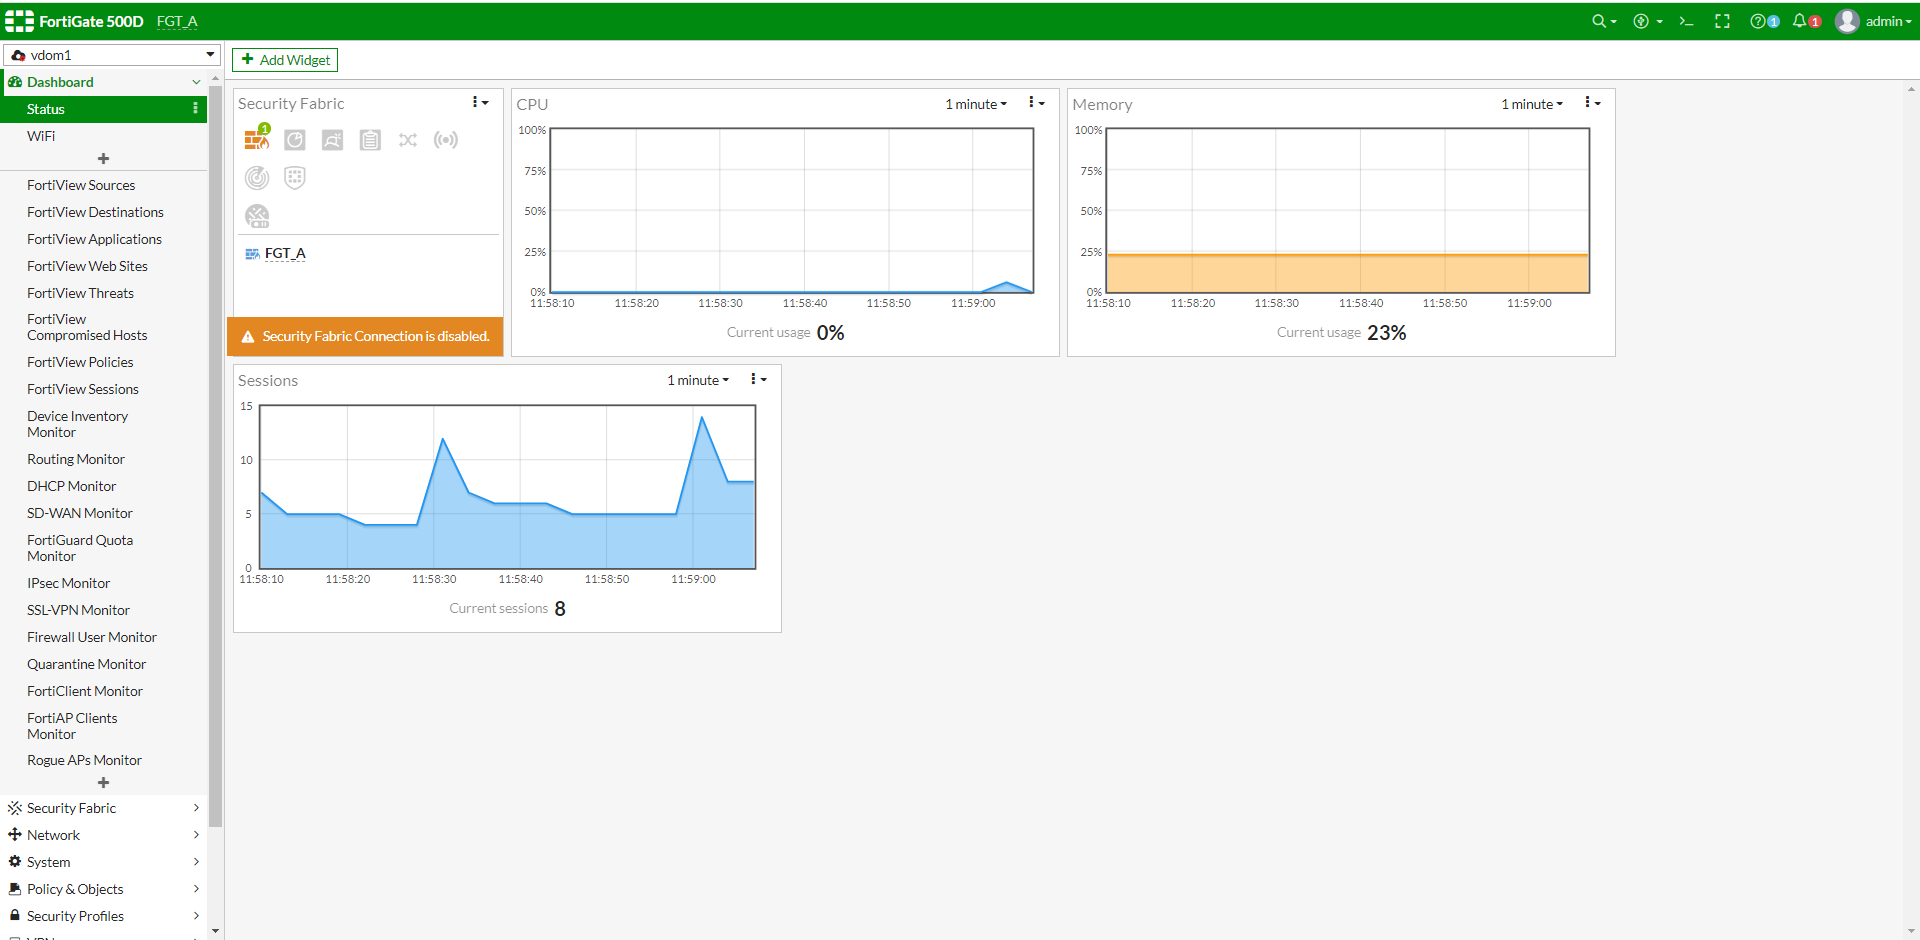
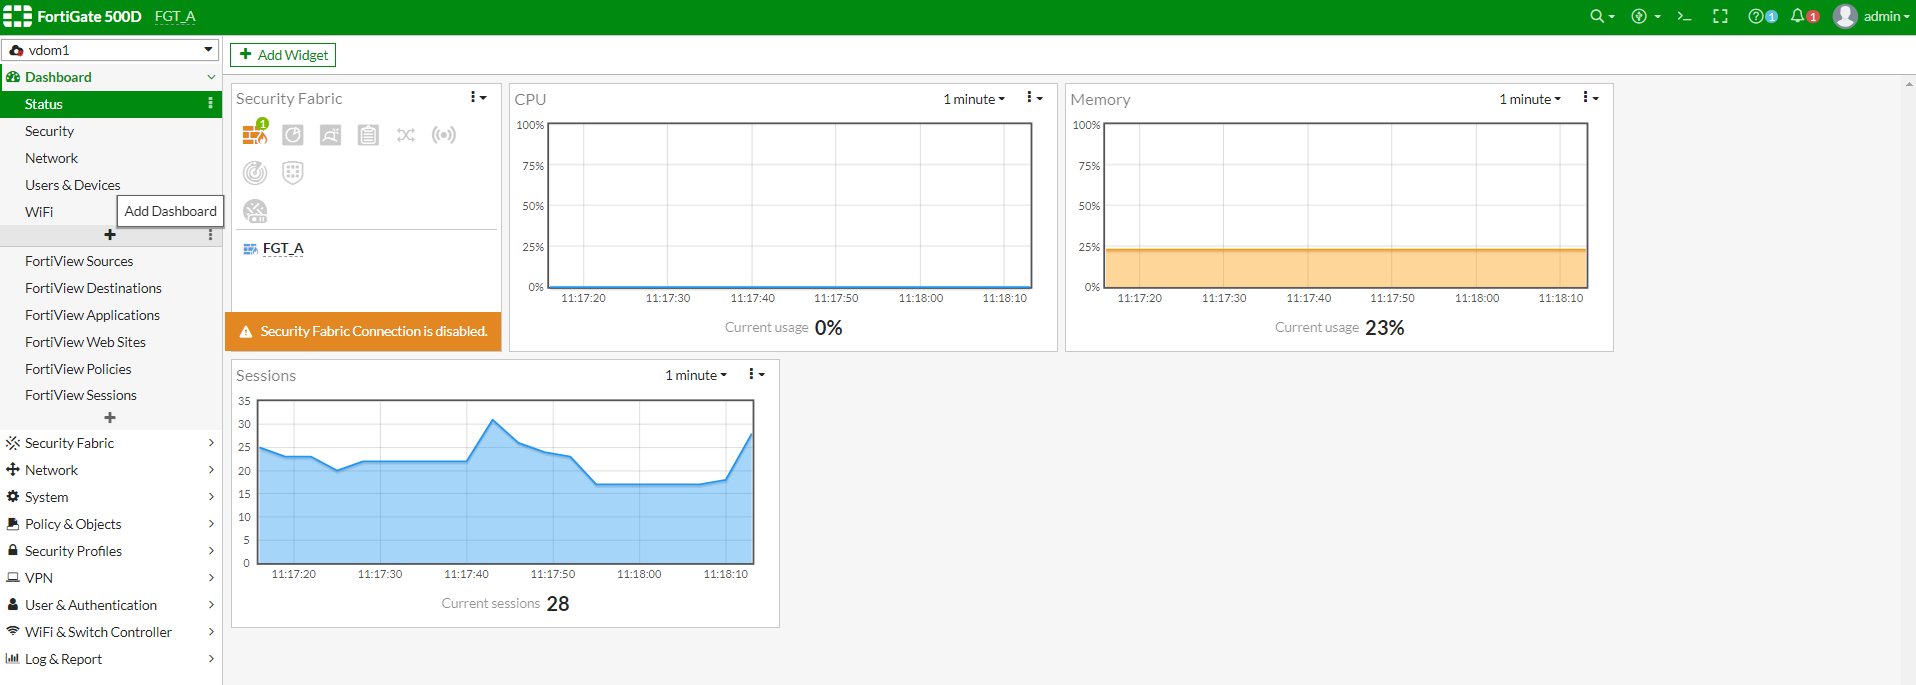
Optimal Dashboard Status, Security, Network, Users & Devices, WiFi Monitor FortiView Sources, FortiView Destinations, FortiView Applications, FortiView Web Sites, FortiView Policies, FortiView Sessions Comprehensive Dashboard Status, WiFi Monitor FortiView Sources, FortiView Destinations, FortiView Applications, FortiView Web Sites, FortiView Threats, FortiView Compromised Hosts, FortiView Policies, FortiView Sessions, Device Inventory Monitor, Routing Monitor, DHCP Monitor, SD-WAN Monitor, FortiGuard Quota Monitor, IPsec Monitor, SSL-VPN Monitor, Firewall User Monitor, Quarantine Monitor, FortiClient Monitor, FortiAP Clients Monitor, Rogue APs Monitor - After the setup is complete, you have the option to watch video about new features in FortiOS 6.4.1.

To add a dashboard with the GUI:
- Under Dashboard, click the Add Dashboard button.
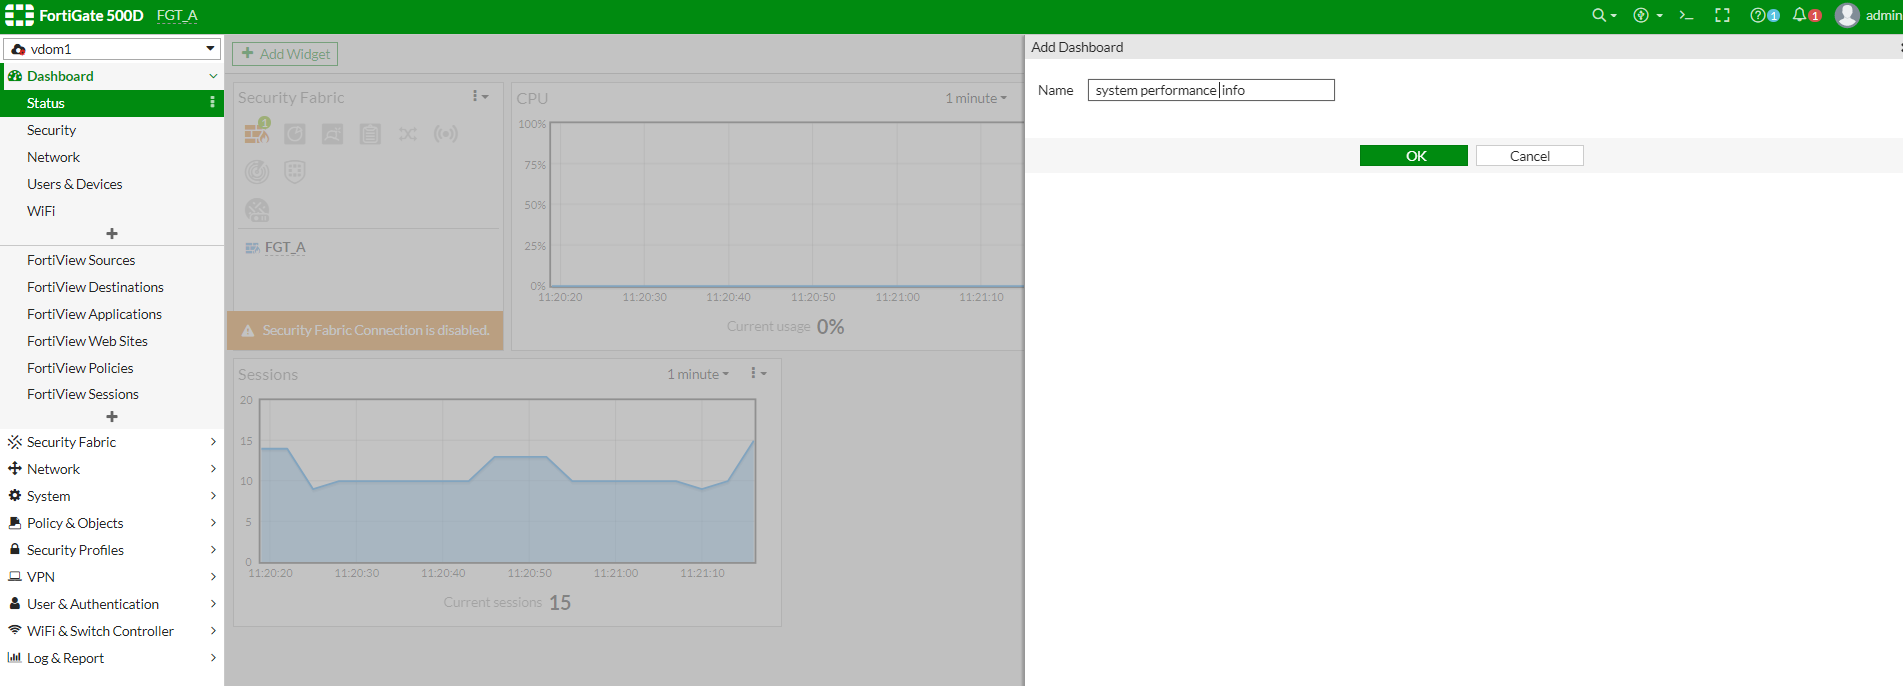
The Add Dashboard window opens.
- In the Name field, enter a name for the dashboard and click OK. The new dashboard opens.
- Click Add Widget.
The Add Dashboard Widget window opens.
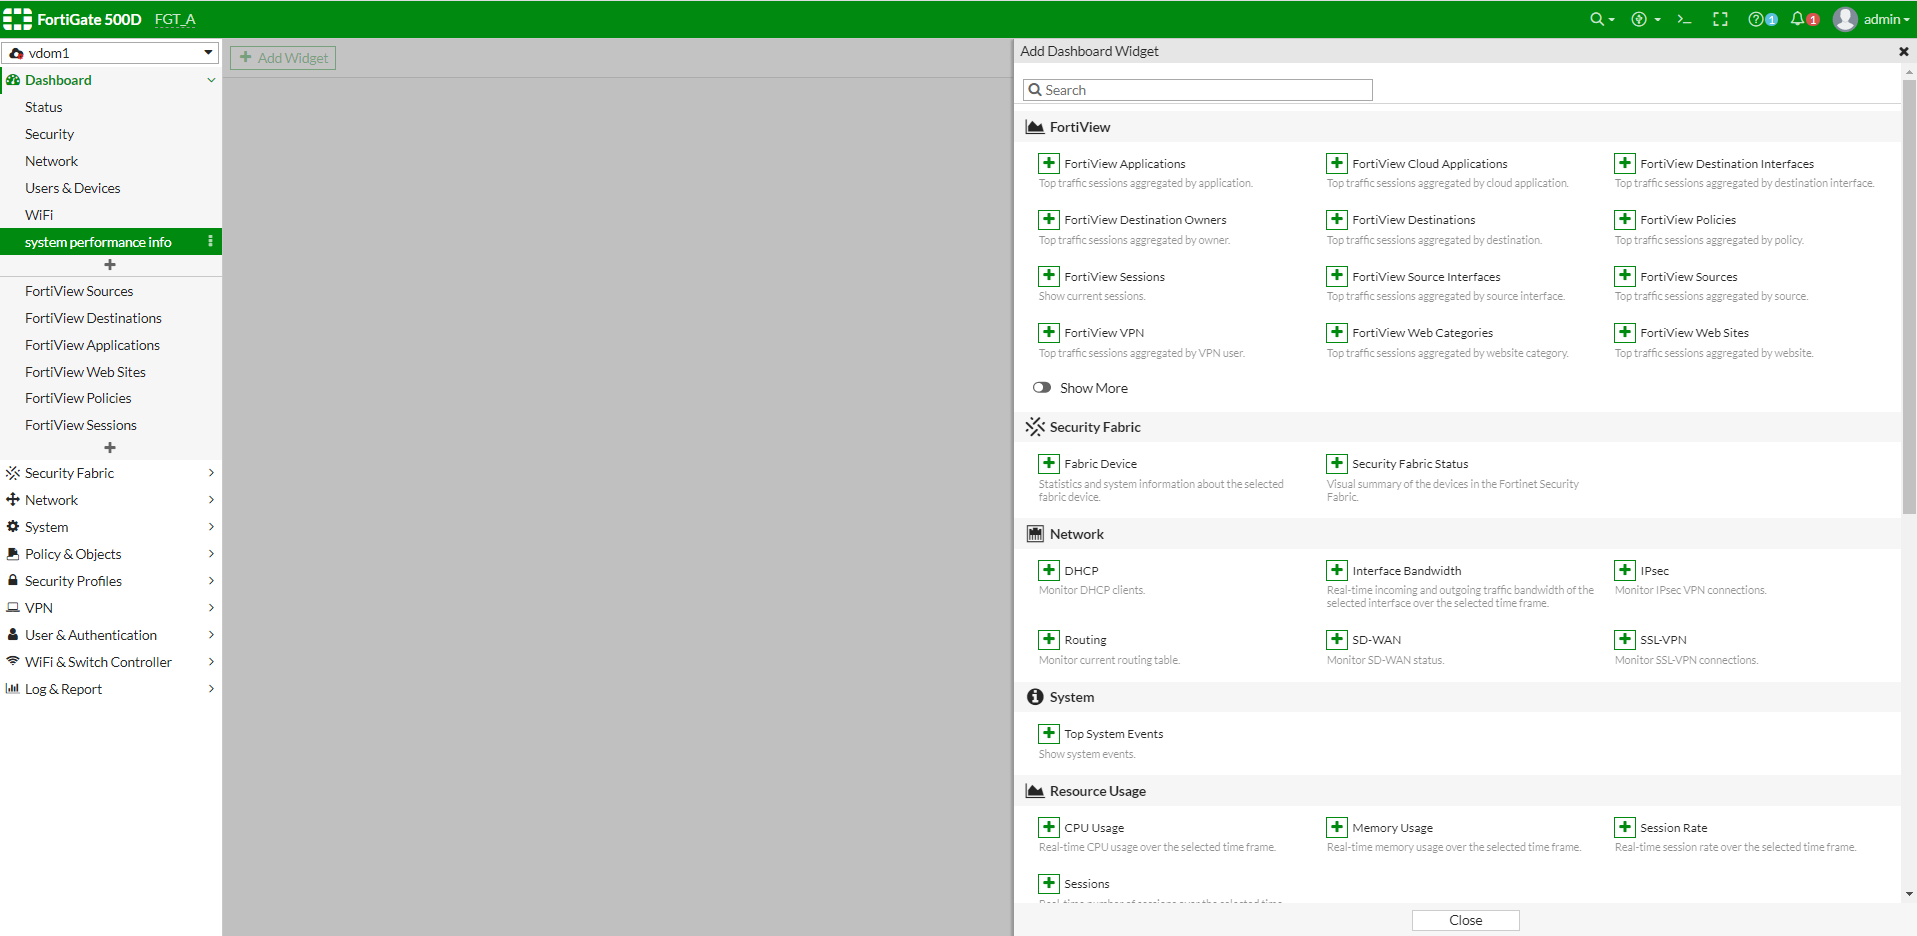
- Click the Add button next to the widget and configure the widget settings. You can add more than one widget at a time.
- Click Close.
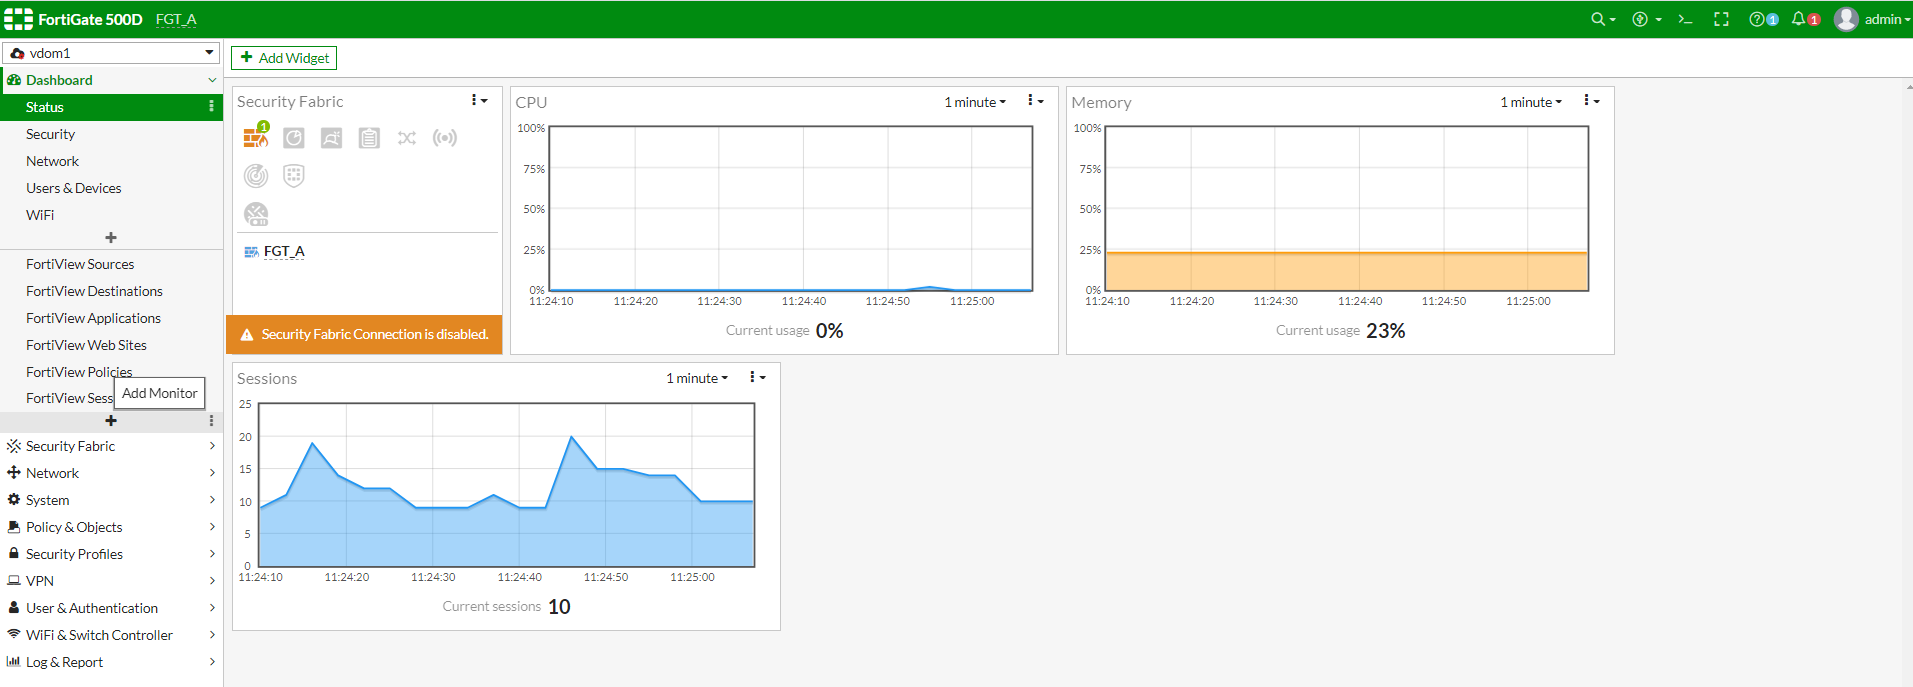
To add a monitor with the GUI:
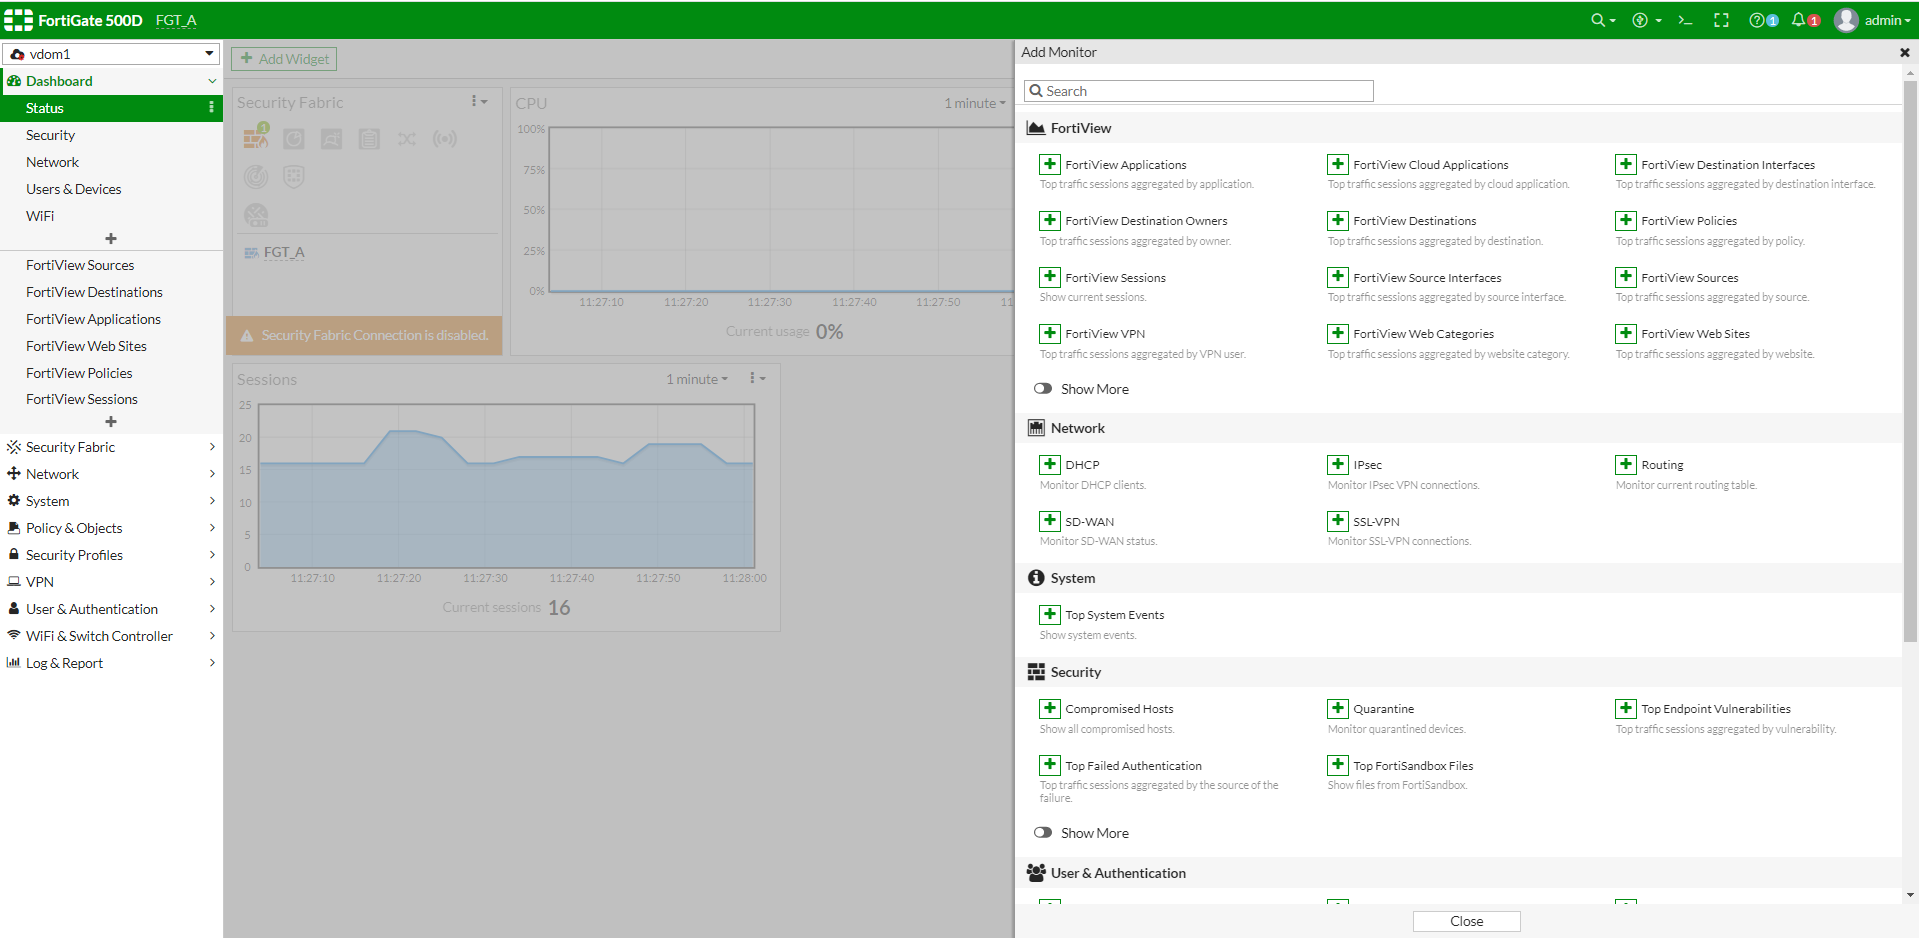
- Click the Add Monitor button. The Add Monitor window opens.
- Click the Add button next a monitor.
- Configure the monitor settings.
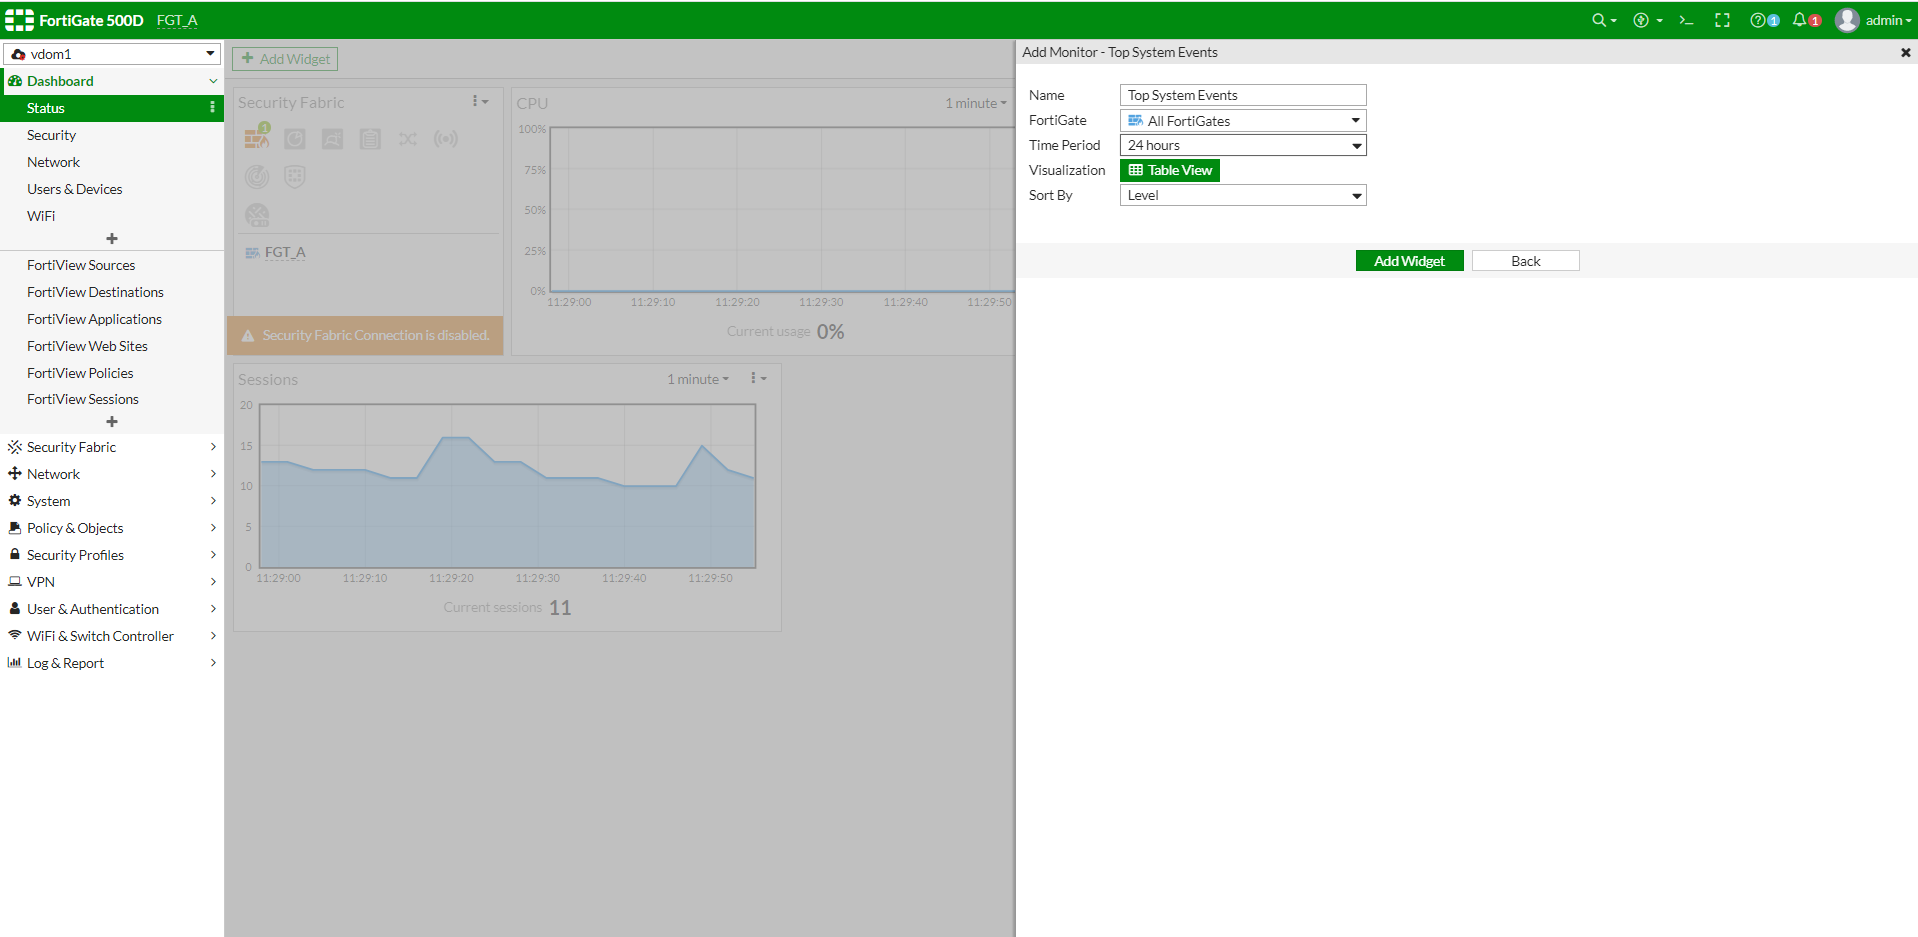
The monitor is added to the tree menu.

To change the dashboard from Optimal to Comprehensive view with the GUI:
-
Click the menu icon at the right side of the Add Dashboards or Add Monitors button and click Reset all Dashboards.

- Select Comprehensive and click OK.
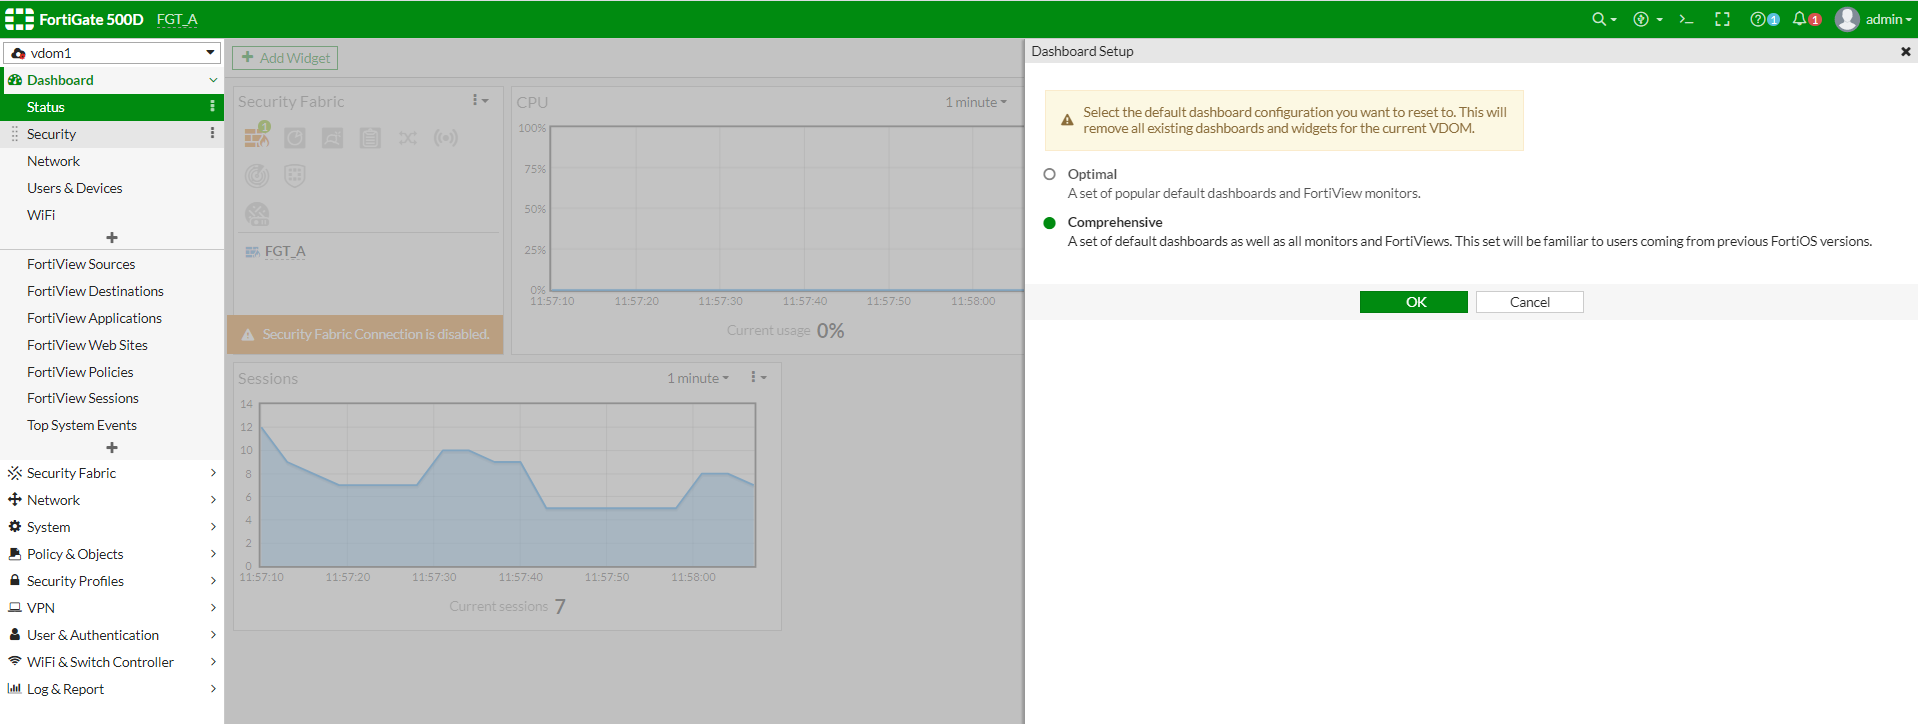
The default template is updated in the tree menu.