Fortinet black logo

Results

6.2.0
Copy Link
Copy Doc ID 1e9179fe-c082-11ea-8b7d-00505692583a:337691
Download PDF

Results

The following GUI pages show the function of the Fortinet secure SD-WAN deployed with Zscaler Internet Access (ZIA) and can be used to confirm that it is setup and running correctly:

Interface usage

Go to Network > SD-WAN to review the SD-WAN interface usage.

Select Bandwidth to see donut charts of the Upstream and Downstream bandwidth for each interface.
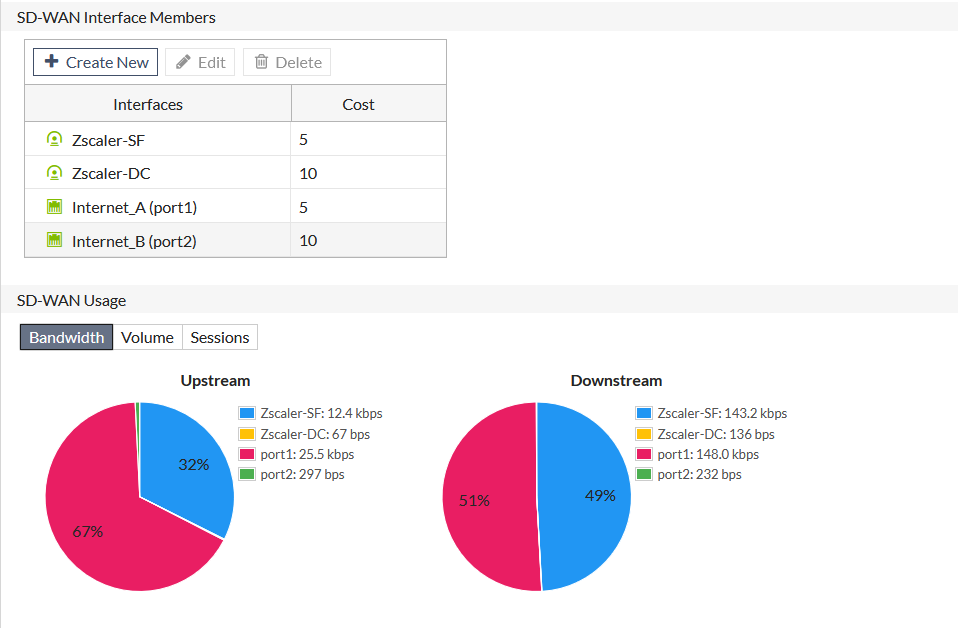
SD-WAN zones bandwidth information

Select Volume to see donut charts of the received and sent bytes over the interfaces.
SD-WAN zones volume information

Select Sessions to see a donut chart of the number of active sessions on each interface.
SD-WAN zones sessions information

IPsec status

Go to Monitor > IPsec Monitor to review all IPsec tunnels.

The IPsec widget

Performance SLA

Go to Network > Performance SLA and select the SLA from the table (Zscaler_VPNTEST in this example) to view the packet loss, latency, and jitter on each SD-WAN member in the health check server.

Select Packet Loss to see the percentage of packets lost for each member.
Performance SLA packet loss information

Select Latency to see the current latency, in milliseconds, for each member.
Performance SLA latency information

Select Jitter to see the jitter, in milliseconds, for each member.
Performance SLA jitter information

Routing table

Go to Monitor > Routing Monitor and select Static & Dynamic to review all static and dynamic routes.

Static and dynamic routing of the network

Firewall policy

Go to Policy & Objects > IPv4 Policy to review the firewall policy.

Verify firewall policies

Top sources

Go to FortiView > All Sessions to confirm that web traffic (ports 443 and 80) flows through the right overlay interface member, and non-web traffic flows through the right underlay interface member.

The Top Sources FortiView

Results

The following GUI pages show the function of the Fortinet secure SD-WAN deployed with Zscaler Internet Access (ZIA) and can be used to confirm that it is setup and running correctly:

Interface usage

Go to Network > SD-WAN to review the SD-WAN interface usage.

Select Bandwidth to see donut charts of the Upstream and Downstream bandwidth for each interface.
SD-WAN zones bandwidth information

Select Volume to see donut charts of the received and sent bytes over the interfaces.
SD-WAN zones volume information

Select Sessions to see a donut chart of the number of active sessions on each interface.
SD-WAN zones sessions information

IPsec status

Go to Monitor > IPsec Monitor to review all IPsec tunnels.

The IPsec widget

Performance SLA

Go to Network > Performance SLA and select the SLA from the table (Zscaler_VPNTEST in this example) to view the packet loss, latency, and jitter on each SD-WAN member in the health check server.

Select Packet Loss to see the percentage of packets lost for each member.
Performance SLA packet loss information

Select Latency to see the current latency, in milliseconds, for each member.
Performance SLA latency information

Select Jitter to see the jitter, in milliseconds, for each member.
Performance SLA jitter information

Routing table

Go to Monitor > Routing Monitor and select Static & Dynamic to review all static and dynamic routes.

Static and dynamic routing of the network

Firewall policy

Go to Policy & Objects > IPv4 Policy to review the firewall policy.

Verify firewall policies

Top sources

Go to FortiView > All Sessions to confirm that web traffic (ports 443 and 80) flows through the right overlay interface member, and non-web traffic flows through the right underlay interface member.

The Top Sources FortiView