


Filters
The Filters area enables you to define a query that filters the activity events to display in the result tables. It comprises the following filters:

Note – This area also enables you to save queries and to redisplay saved queries, as described in Saving Queries and Saved Queries.
|
Filter |
Description |
|---|---|
| Category Filter |
The Category filter enables you to filter the activity events by their Category.
|
| Device Filter |
The Device filter enables you to filter by a specific device[s].
|
| Free-text Query Filter |
This filter enables you to specify a free-text query to filter the results. This filter uses Lucene syntax. For details about the supported Lucene syntax features, see Appendix B - Lucene Syntax.
To simply query definition, the free-text query filter has an auto-complete helper dropdown list that contains all the available activity event fields, as well as available syntax operators. Simply start typing to see a dropdown menu of options. The automatic-complete helper guides you through the process of creating a query by displaying appropriate options in the dropdown menus, such as fields and operators when appropriate.
|
| Time Filter |
The Time filter enables you to filter for a specific time period. The default is the last hour.
|


To clear the contents of all the filters in the Filters area, at the far right of the page, click the  button and select Clear all.
Saving Queries and Saved Queries
After filtering the activity events displayed in the result tables, you can save the query to be redisplayed when needed. Saving a query in this manner also enables you to define it as a Scheduled Query in order to automate the process of threat detection.
To save a query:
- Use the filters to display the desired filtered events in the result tables.
- In the Filters area, at the far right of the page, click the button and select Save Query. The following displays populated with the current filter definitions. The Category, Device and Time dropdown menus show the filter selections and the box underneath it shows the actual query string. For example, as shown below:
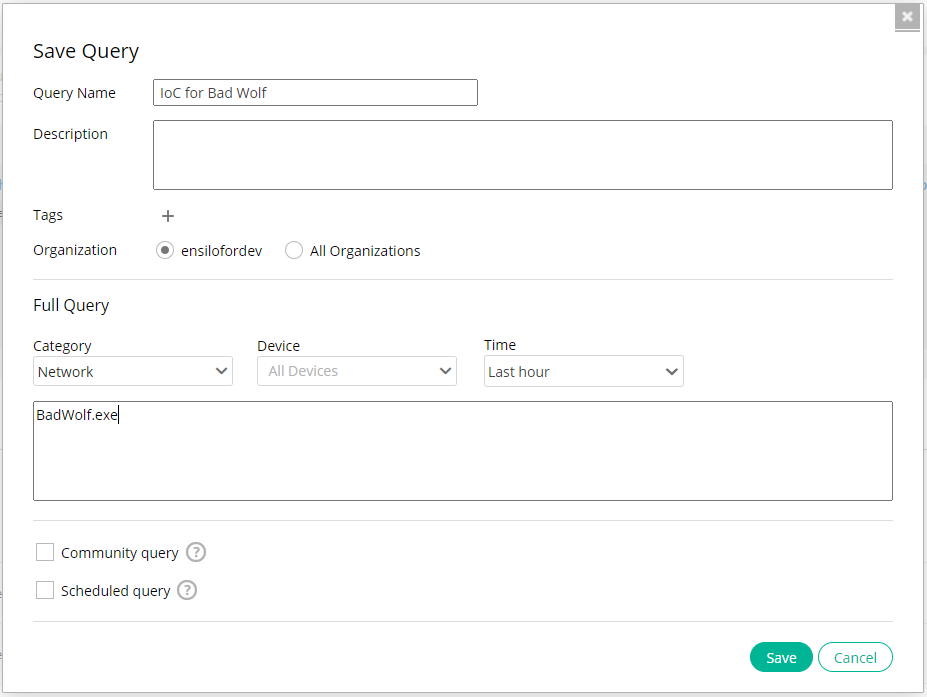
- Fill in or modify the definitions of this saved query, as follows:
- Query Name: Enter any free text name describing this query.
- Description: Enter any free text description of this query.
- Tags: Enables you to assign one or more metadata tags to this query. You can assign a previously defined tag to this query or define a new tag. These tags can then be used for general information purposes and for searching through queries in the Event Viewer.
Note – These tags only relate to saved queries.

Click the + to assign tag(s) to this query. The following displays:
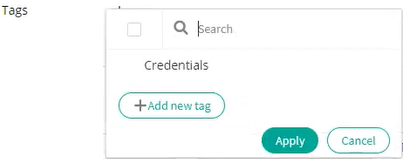
All previously defined tags (for any query in your organization) are listed for your selection.
If this tag is assigned to this query, a checkmark appears on its left:
 .
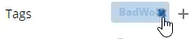
.To assign a tag to this query, simply click on it. It will then show the checkmark to its left. Each tag that you assign appears as an icon, as follows:

To unassigned a tag from a query, click on it in the list so that its checkmark is removed or hover over it to display an X and then click the X to delete it, as shown below:
To create a new tag, click the + Add New Tag button.
To modify the name of the tag or to delete it from the list (and from all queries to which it was assigned previously in the organization(s) of the logged in user), hover over it and click the Edit or Delete icon, as needed.

Click the Apply button to assign all the selected tags (with checkmarks) to this query.
- Organization: Specifies the name of the organization in a multi-organization FortiEDR environment when the logged in user has a Hoster role. In a single-organization FortiEDR system, this field does not appear.
- The Category, Device and Time dropdown menus show the filter selections and enable you to modify the selection.
- Query String Box: Displays the actual query string according to the selections made above and enables you to modify it.
- Community Query: Select this option to specify that it is shared with the entire FortiEDR community including other organizations.
Note – After you have defined a Community Query and saved it, you can edit it. Unchecking the Community Query option means that this query is no longer available to the FortiEDR community. If however, a community member already copied this query, they will still have it, even after you unshare it here.
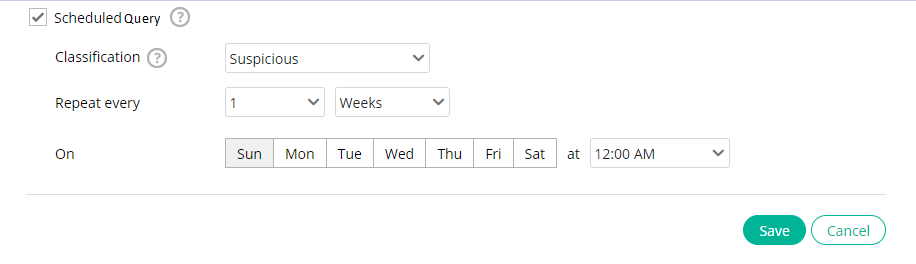
- Scheduled Query: Mark this option to automate the process of detecting threats so that this query is run automatically according to the schedule that you define. A security event is automatically created in the Event Viewer upon detecting threats (query matches). Notifications are sent according to the security event’s definition, such as via email, Syslog and so on.
Marking this checkbox shows the following options:
The time range of the activity events that this query matches is determined by the frequency of the schedule. For example, if you define that the query automatically runs once a week, then each time it runs, it will match and create a security event for all the activity events in the most recent week; the same goes for it being scheduled once a month – in this case, the query will match all the activity events in the most recent month.
Define the scheduled query, as follows:
Field
Definition
Classification Select the classification of the Security Event to be issued when the scheduled query has run and found matches. The Classification specifies how malicious the security event is, if at all. Classifications are initially determined by FortiEDR automatically or manually and are shown in the Event Viewer, as described in Classification Details. They can be:
- Malicious
- Suspicious
- Inconclusive
- Likely Safe
- PUP (Potentially Unwanted Program)
- Safe
Repeat Every/On These options enable you to define the frequency and schedule when this query will be run. For example, to repeat the query every week on Sunday, make the selections shown in the screen above.
- Click the Save button to save this query so that it is available to be redisplayed, as described below. The system runs the query immediately in order to verify that it is functional.
Note – if the system detects a large quantity of events about which to send notifications, then a warning message is displayed suggesting that you refine the query so that there are less matches. The reason being that extremely large quantities of notifications may be more of a hindrance than a help.
To display a saved query:
- In the Filters area, at the far right of the page, click the button and select Saved Queries. The following displays listing all the queries that were saved using the Save Query option.
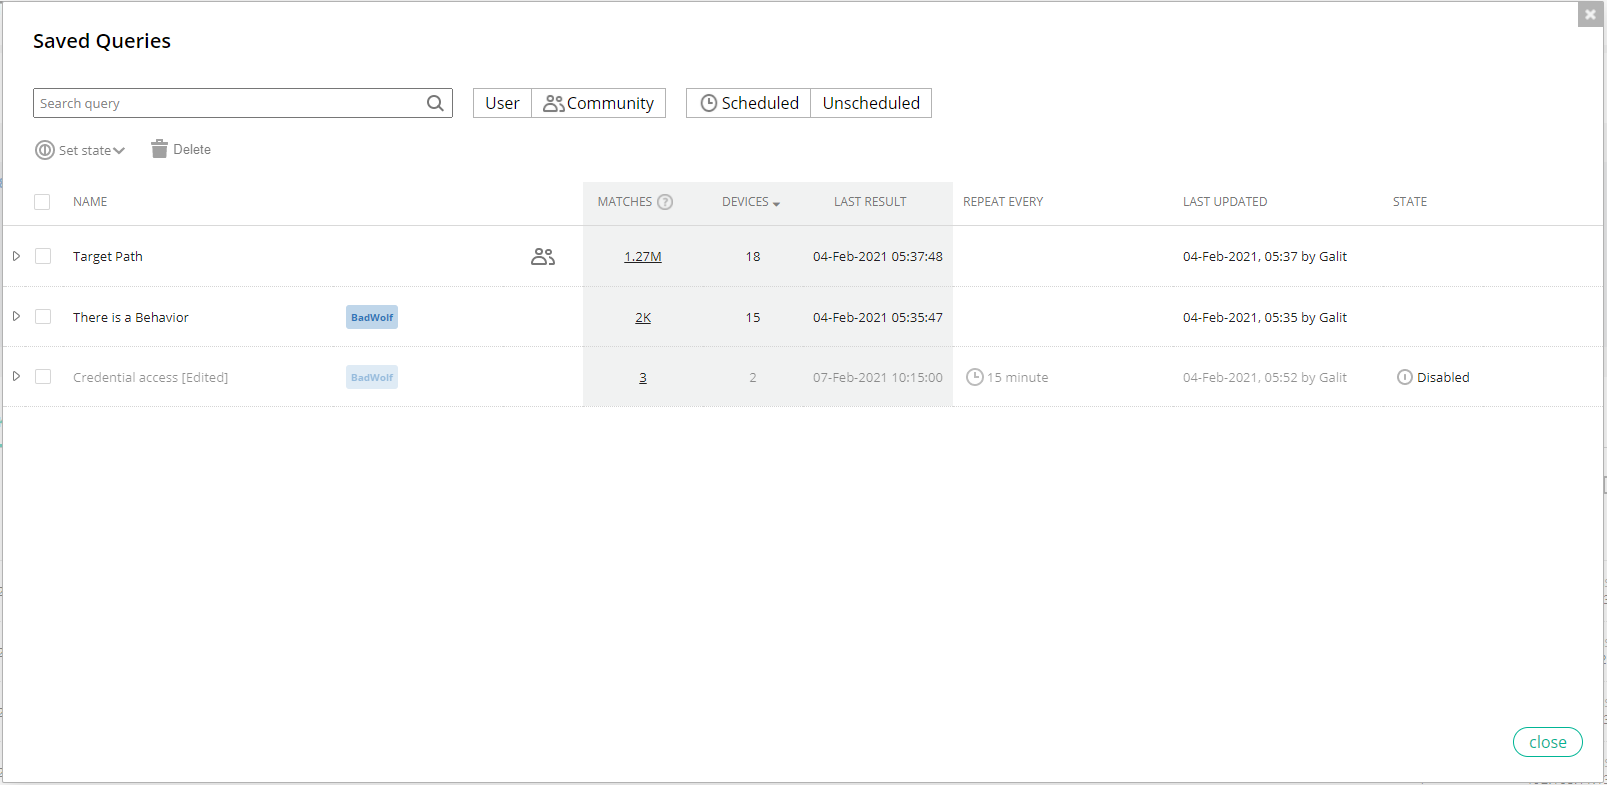
For each saved query, this list shows the quantity of matches detected (MATCHES), the quantity of devices on which these matches were detected and the last time the query was run (LAST RESULT). These three columns are highlighted in gray, as shown above. Additional details about the queries definition are also displayed in each row.
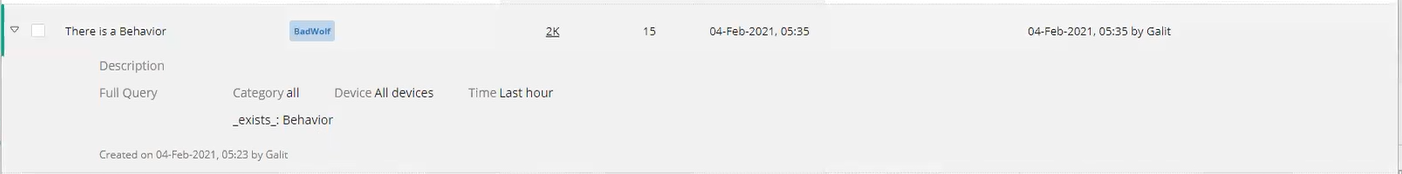
- Click on the row of a Saved Query to display additional details about that query’s most recent run. For example, as shown below:
- You can filter this list of saved queries by typing into the Search field and/or selecting one of the following options:
- Scheduled/Unscheduled: To specify that Scheduled Queries are listed in this window, click the Scheduled option. A Scheduled Query is one whose Scheduled Query field was marked when it was created/modified.
- Community/User: To specify that Community Queries are listed in this window, click the Community option. A Community Query is one whose Community Query field was marked when it was created/modified.
 appears in the list next to Community Queries. User refers to queries that are not Community Queries, meaning that each one is only available to the Organization for which it was created.
-
4 You can modify a Saved Query by hovering over it. The following tools are displayed on the right of the row:

Tool
Definition
Run Now 
To run and detect activity events now according to this Saved Query. Edit 
To edit the Saved Query definition. Delete 
To delete the Saved Query. Multiple queries can be deleted at once by marking the checkboxes on the left side of each row and then clicking the Delete  icon at the top of the window.
 - To enable/disable a saved query, mark the checkboxes on the left side of the relevant rows and select the Enable/Disable option in the Set State dropdown menu.

Scheduled Queries
Scheduled queries enable you to automate the process of detecting threats so that it is activated automatically according to the schedule that you define. This will enable timely and continuous detection and notification of threats. A Scheduled Query runs automatically when you define a Query as a Scheduled Query, as described below. Each time it runs and detects a match, it generates a security event in the Event Viewer, and sends a notification (via email, Syslog and so on) according to the security event’s definition.
The security event that is generated by a Scheduled Query in the Event Viewer is similar to a standard security event, except for the following:
- The following options are not available in the Event Viewer for Saved Query Security Events:
-
 The Forensics option is not available because it is irrelevant.
  An Exception cannot be defined for Saved Query Security Event.
-
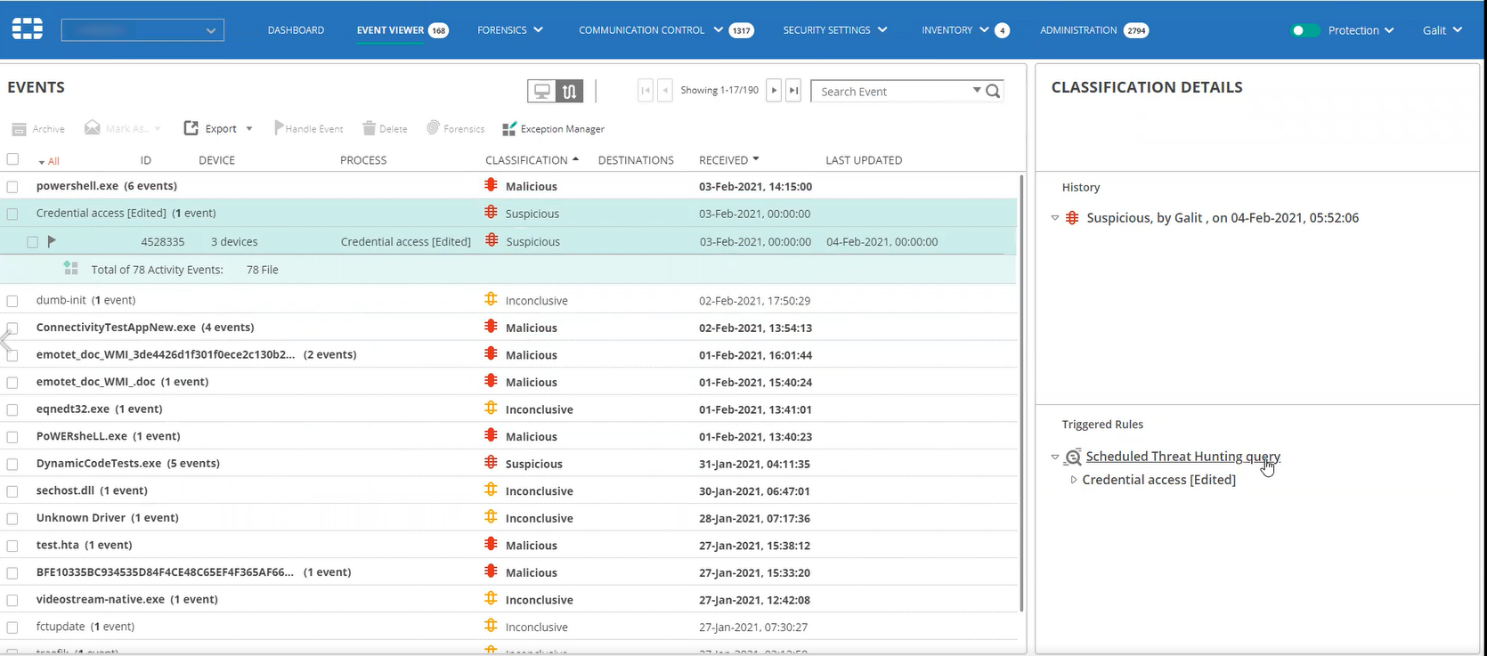
- In the Process View
 of the Event Viewer, a Saved Query Security Event shows the name of the Saved Query instead of the process name, as shown below:
The Classification (in the CLASSIFICATION column) is determined by the definition of the Saved Query.
In the same manner as other security events it indicates the quantity of devices (in the DEVICE column) on which this type of activity events were found. All other aspects of a Saved Query Security Event are the same as other security events.
- Clicking the Threat Hunting option on the right side of the Saved Query Security Event in the Event Viewer displays the Threat Hunting tab and the Saved Query that was run, because that is what triggered the security event.

- The Event Viewer does not show any ADVANCED DATA for a Saved Query Security Event.

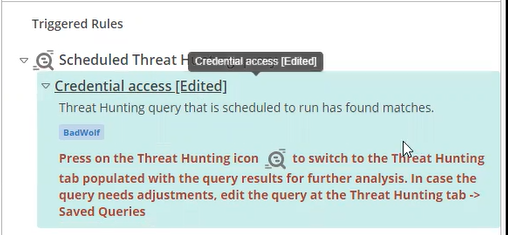
- Triggered Rules: When a Saved Query Security Event is selected in the Event Viewer, the Triggered Rules pane on the bottom right of the page indicates that this security event was triggered by a Scheduled Threat Hunting Query, as shown below:
The name of the saved query is listed below it. Click that Saved Query’s name (for example, Credential Access (Edited)) to display additional details about this saved query, such as its description and the tags that were defined when it was created/modified, as shown below:
- In the Device View
 of the Event Viewer, a Saved Query Security Event appears under the devices that were affected. It also shows the name of the Saved Query instead of the process name, as shown below:
If this security event was triggered for more than 100 devices, then this row shows a notification indicating that they are not all listed here and that you can use the Threat Hunting in option on the right of this event’s row to investigate further.
