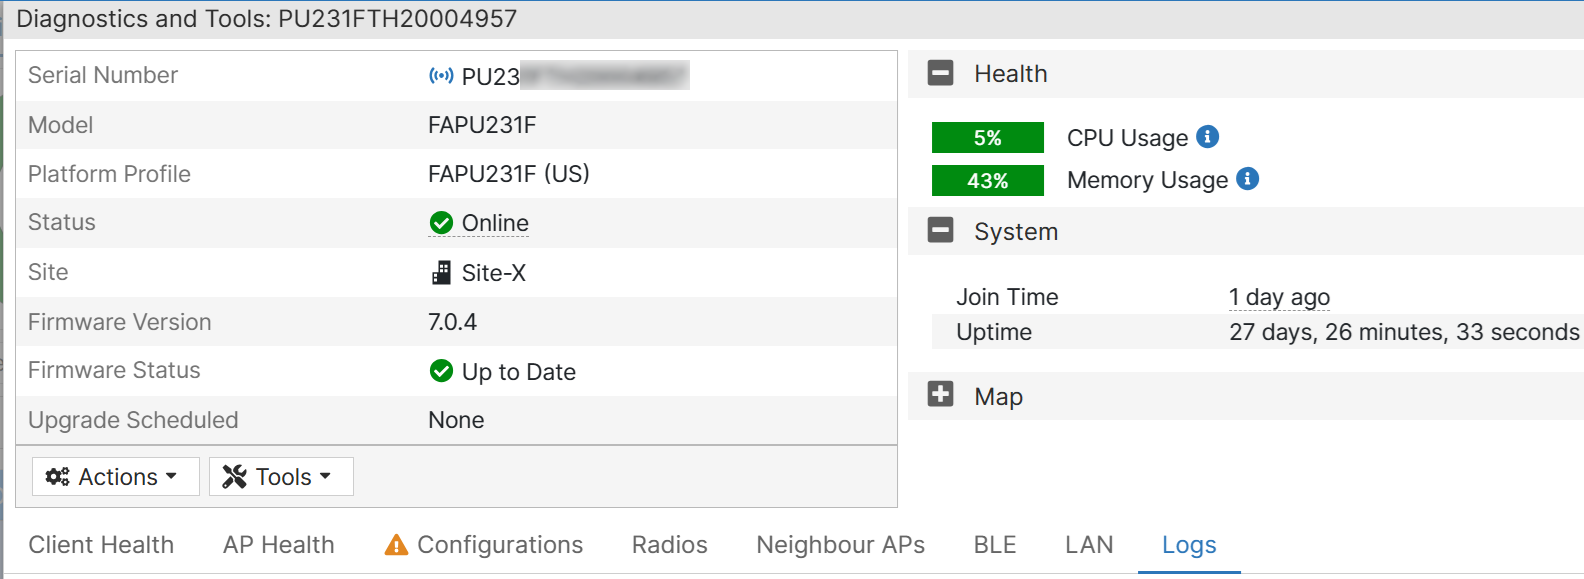
Viewing the FortiAP status
The status view provides vital information about the FortiAP health. It organizes data in various tabs with configuration and operational status of the FortiAP and its radios. Information is classified into charts and lists.
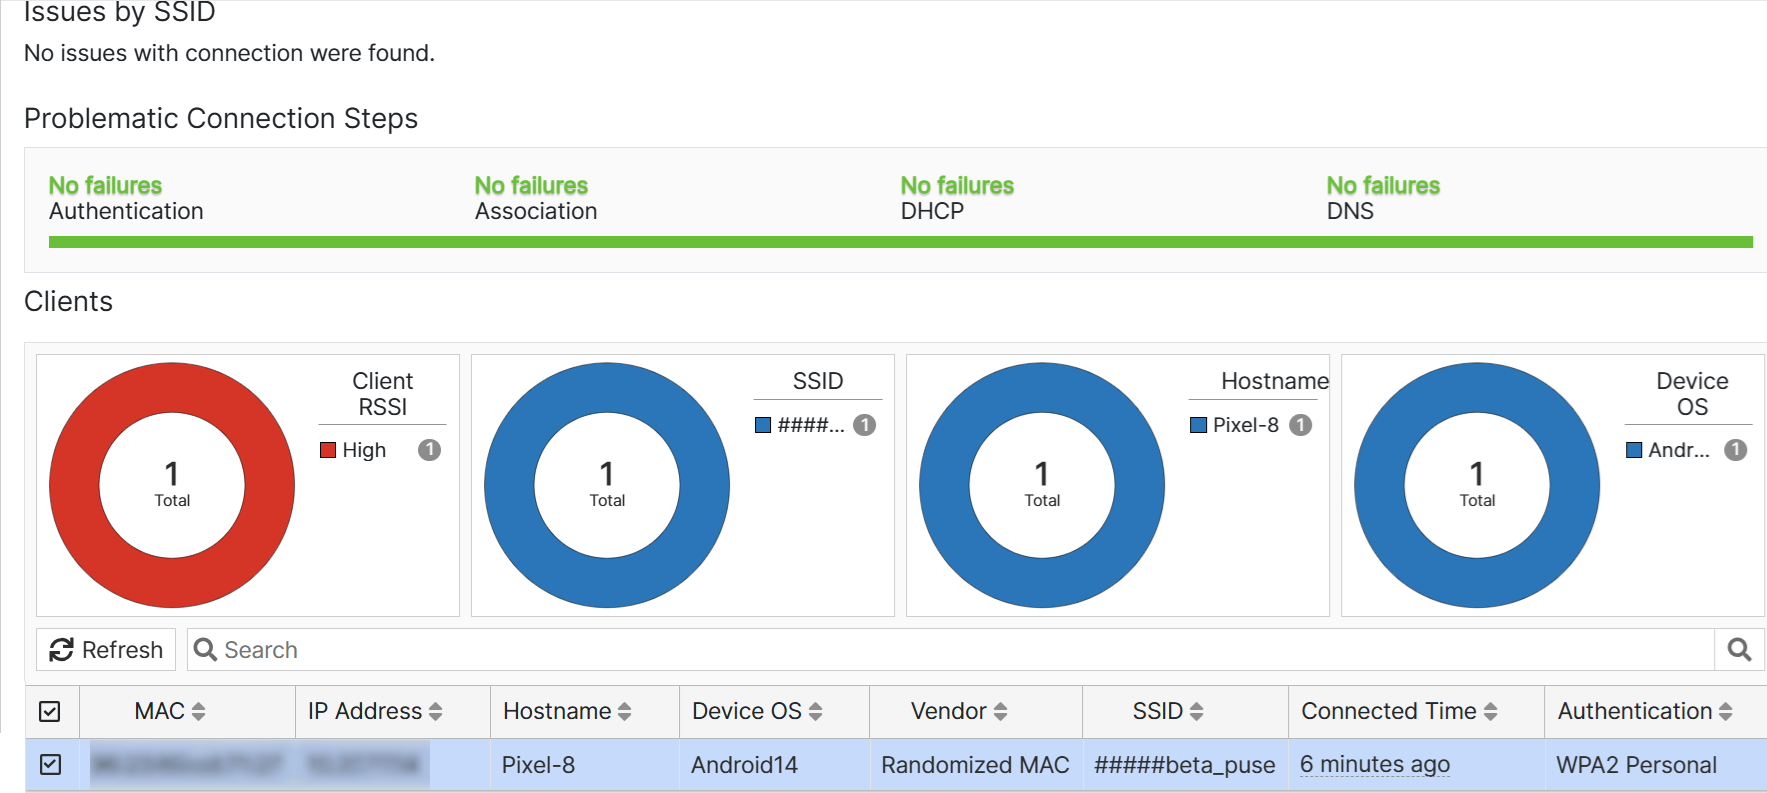
Client Health
This tab displays the wireless client summary, by default, data for the last 12 hours is displayed. You can filter information for specific SSIDs; the client count affected by connection issues and the Association, Authentication, DHCP, and DNS failures are listed. The charts display wireless information such as the client count with good and low RSSI values, device OS, hostname, and the clients per SSID.
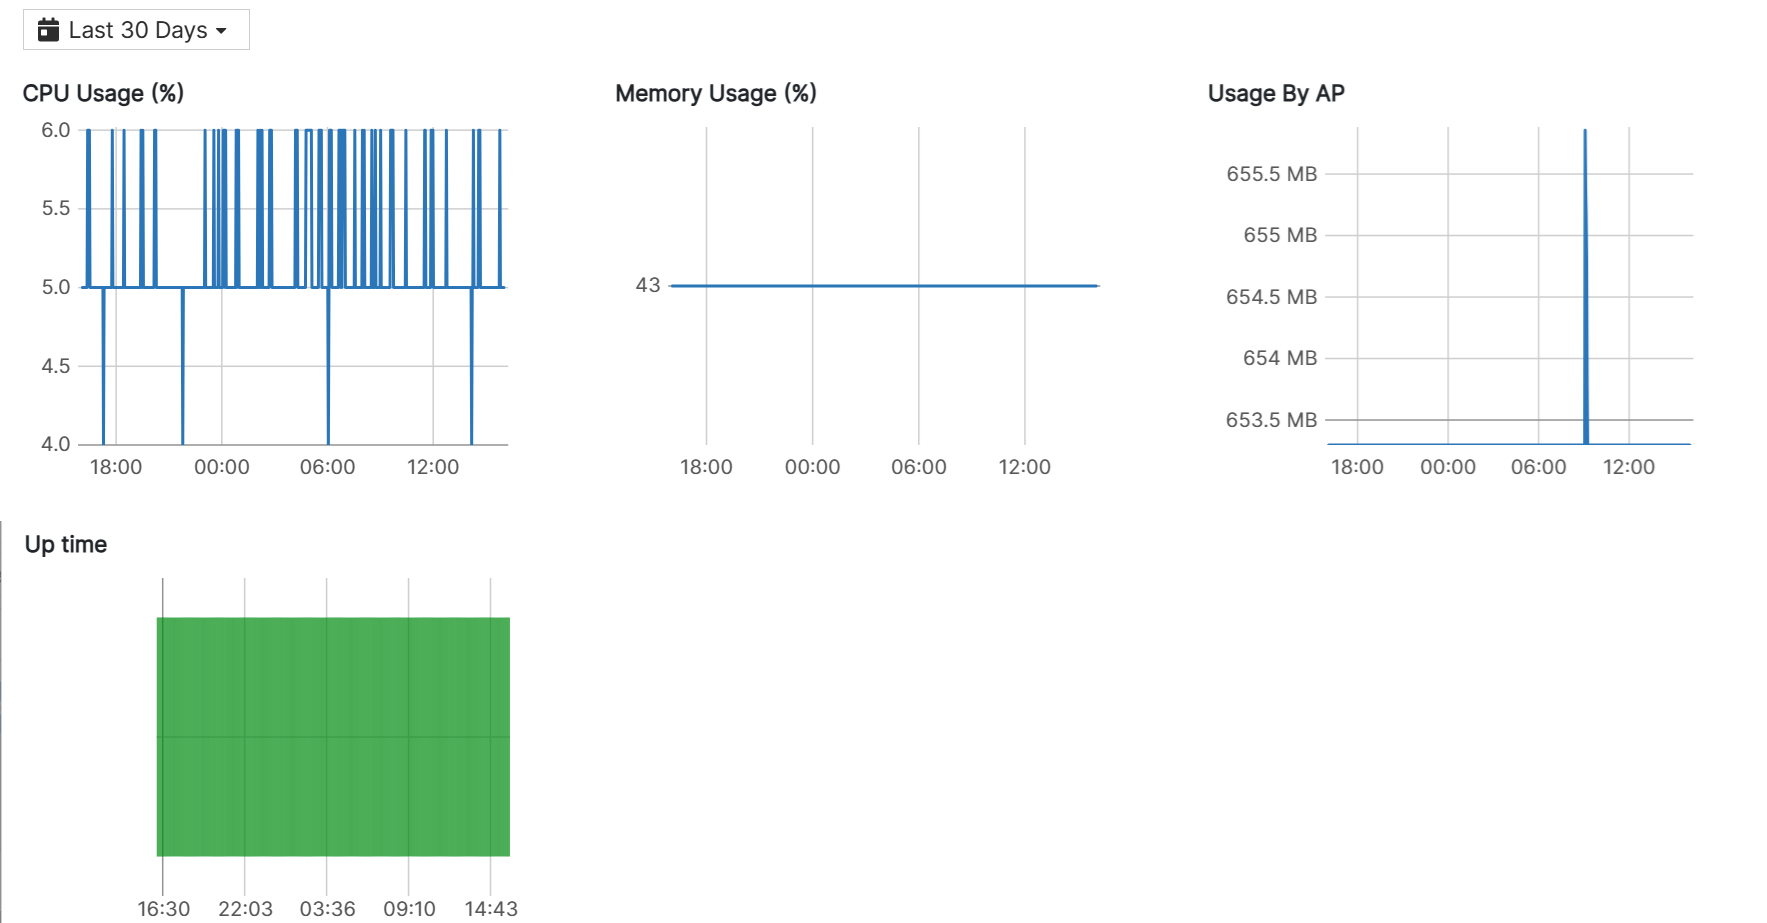
AP Health
This tab displays the aggregate data usage (uplink and downlink) and the FortiAP uptime. You can select the duration for which you wish to view this data. The available durations are 60 minutes and 24 hours.
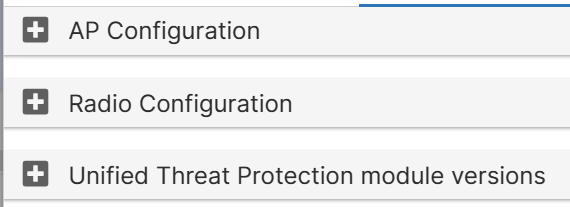
Configurations
This tab displays the FortiAP and radio configurations and the UTP DB and engine versions.
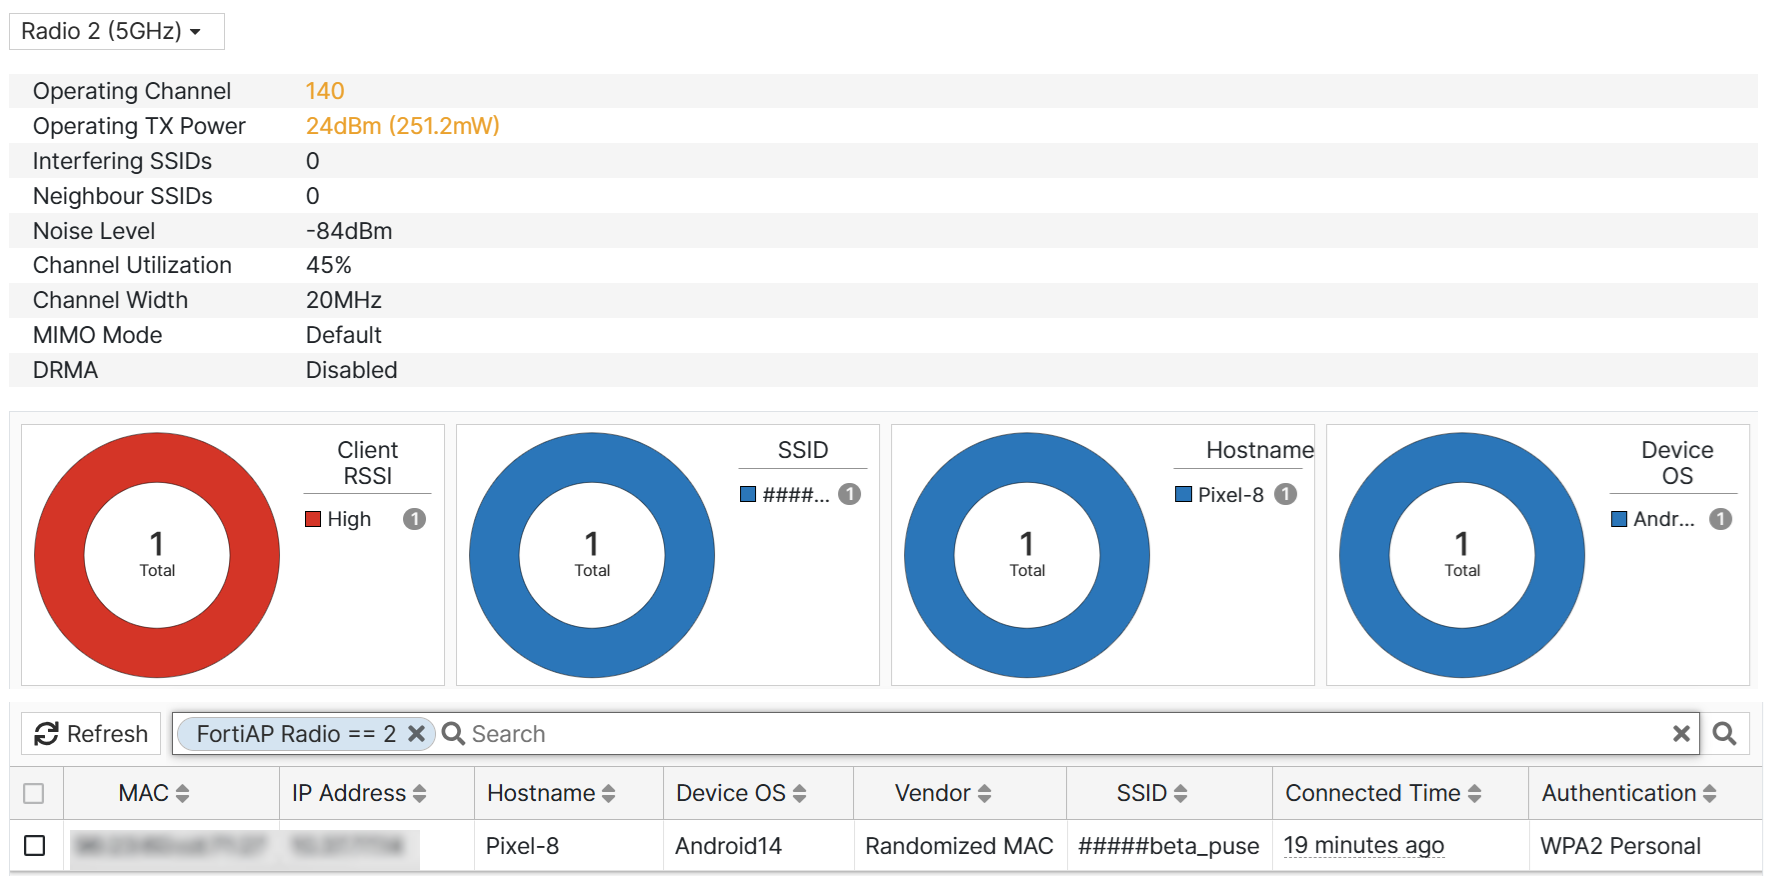
Radios
This tab displays wireless statistics and the list of wireless clients. You can select any one of the 3 radios to view the associated details. This tab displays statistics, such as, the client count with high and low RSSI values, interfering SSIDs, channel width and utilization, associated SSIDs, hostname, client device OS.
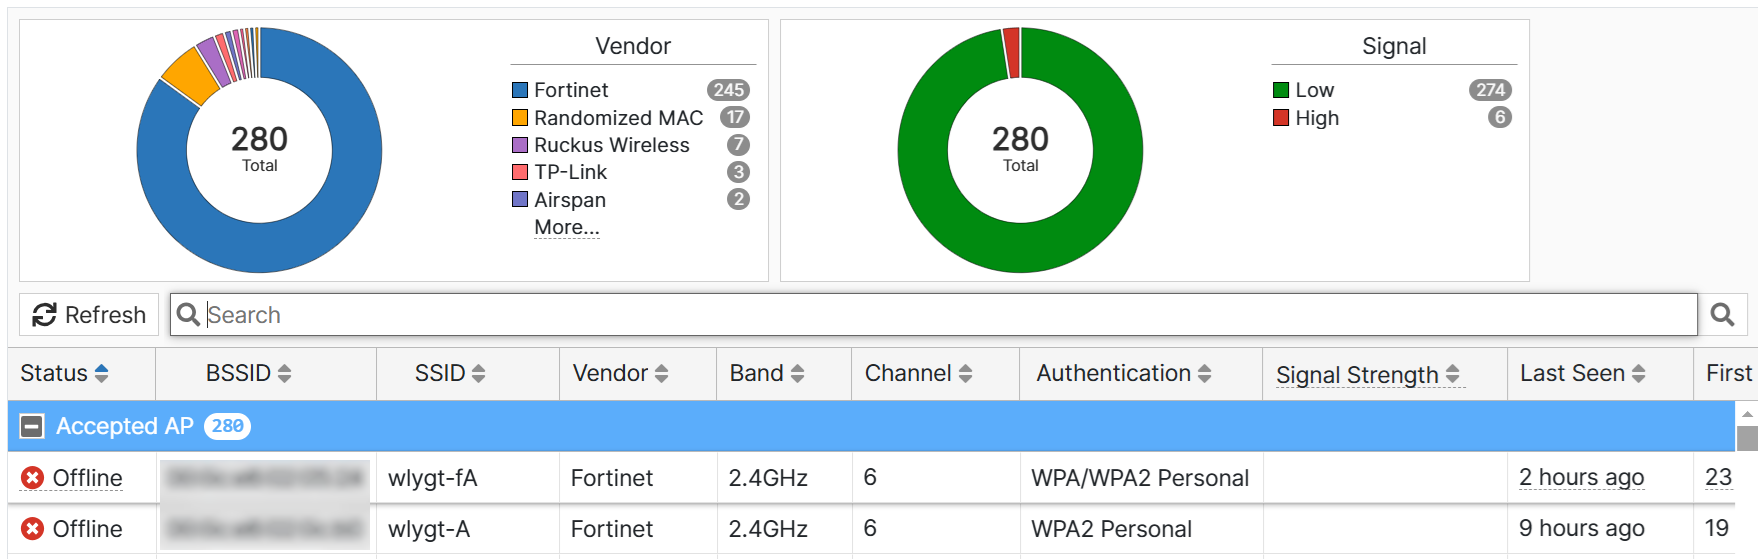
Neighbour APs
This tab displays any neighboring APs detected by this FortiAP and visualizes data on the basis of signal strength and vendor. Click on the displayed data to view the devices and other associated details.
BLE
This tab displays devices detected over BLE with associated details such as the configured UUID, Major ID, and the device manufacturer. Click on the displayed data to view the devices and other details.
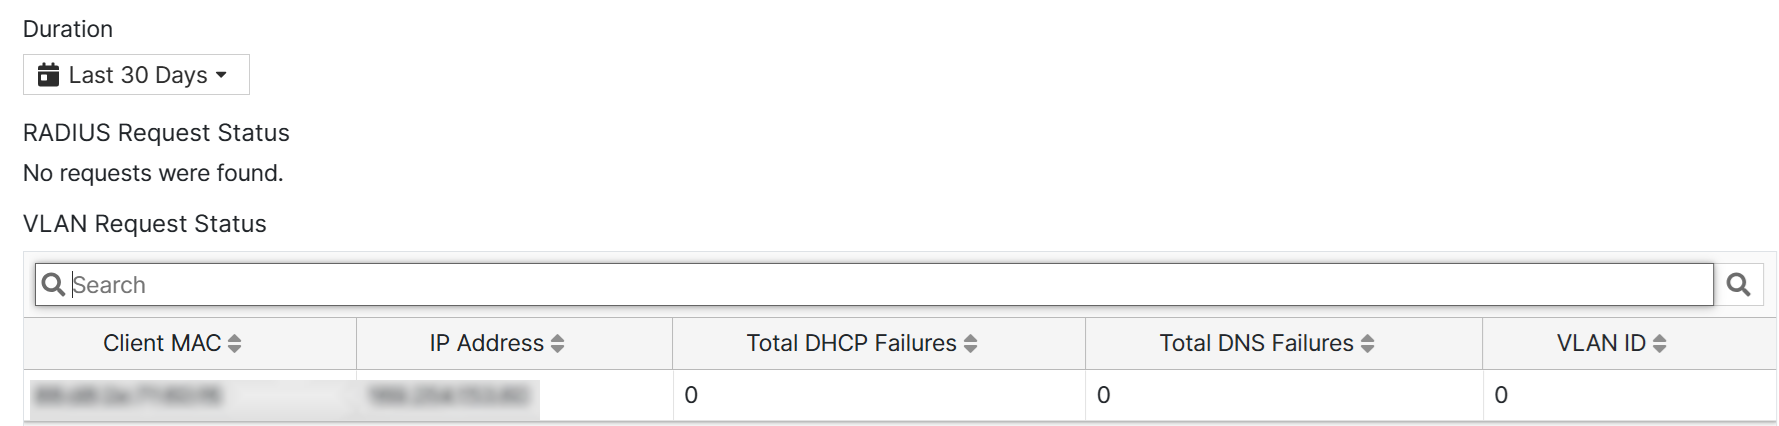
LAN
This tab displays the RADIUS and VLAN request status. You can select the duration for which you wish to view this data. The available durations are 60 minutes, 24 hours, 7 days, and 30 days.
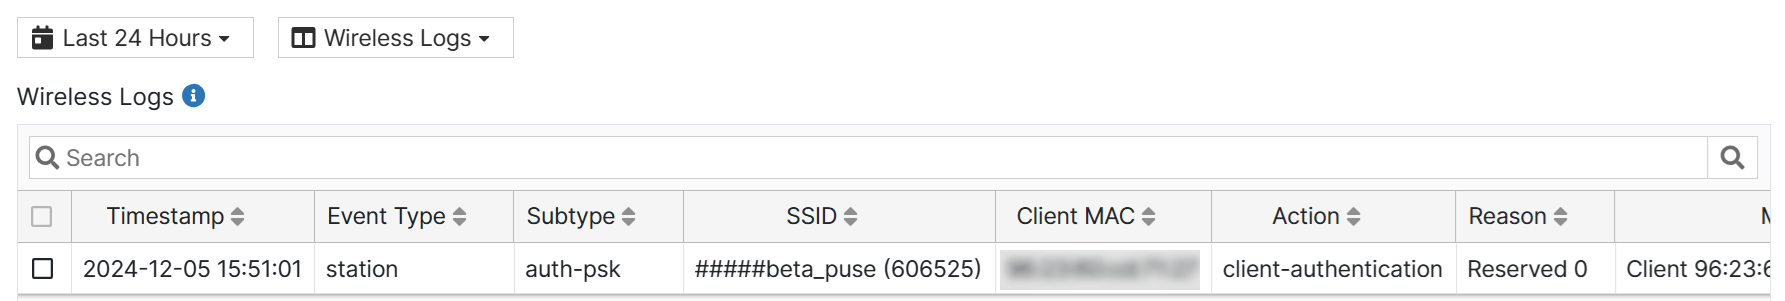
Logs
This tab displays the following logs associated with the FortiAP.
- Wireless Logs
- Antivirus Logs
- Application Control Logs
- Botnet Logs
- IPS Logs
- Web Access Logs
You can set the duration to view FortiAP logs, by default, logs are displayed for the last 24 hours. Up to the last 1000 log entries are displayed.
Note: The FortiAP must have a UTP license to access all logs except Wireless Logs.