


Shadow IT discovery
FortiCASB provides features for shadow IT discovery. By integrating with FortiGate and FortiAnalyzer, FortiCASB gives users a concrete overview of all sanctioned and unsanctioned cloud applications organization wide. Furthermore, FortiCASB calculates a risk score for each application and gives users the ability to control application usage.
FortiCASB's Shadow IT discovery helps users enhance the security of their cloud application environment with the following features:
- Unsanctioned Application Discovery—FortiCASB uses logs from FortiGate and FortiAnalyzer as well as its own discovery process to deliver a comprehensive view of risk and usage of cloud applications.
- Cloud Risk Score—FortiCASB generates a cloud risk score for each cloud application. This score is calculated using many factors, such as but not limited to: user numbers, size of the company, multi-factor authentication support, and service hosting location. These factors are used to generate scores in multiple criteria, which are then aggregated into one final score. Users can prioritize these criteria to match their needs.
- Access Control—Users can block or monitor certain applications using FortiCASB and FortiGate.
- Data Correlation—FortiCASB uses data from FortiGate and FortiAnalyzer, as well as its own data to define and identify riskier activities.
Configuration and requirements
Shadow IT discovery requires a FortiGate or FortiAnalyzer policy.
Configuration details depend on your specific setup requirements. See the scenarios below, and find the one which best suits your needs.
Scenario 1: You want to receive logs from FortiGate.
- See FortiGate configuration. After step 13, follow the instructions under Log configuration using FortiGate GUII. Then, follow the instructions under FortiCASB configuration as needed.
Scenario 2: You want to receive logs from FortiGate, but it is already providing logs to another device.
- See FortiGate configuration. After step 13, follow the instructions under Log configuration using FortiGate CLI. Then, follow the instructions under FortiCASB configuration as needed.
Scenario 3: You want to receive logs from FortiAnalyzer.
- See FortiAnalyzer configuration. Then, follow the instructions under FortiCASB configuration as needed.
FortiGate configuration
- Go to Security Profiles > SSL/SSH Inspection.
- Create a new SSL/SSH inspection profile called deep-test.
- Configure the profile as shown below:
- Go to Security Profiles > Application Control.
- Set all categories to Monitor.
- Under Options, enable Allow and Log DNS Traffic and Replacement Messages for HTTP-based Applications.
- Go to Security Profiles > Cloud Access Security Inspection.
- Under the Action column, set all action to Monitor.
- Go to Policy & Objects > IPv4 Policy.
- Create a new policy named Shadow-IT.
- Configure the policy as shown below:
- Configure Security Profiles.
- To use access control, choose the Web Filter created with the URL filter set.
- Open Application Control to allow FortiCASB to track how many cloud applications are visited.
- To correlate log data with FortiCASB data, make sure Application Control is open, and set SSL/SSH Inspection to deep-test.
- Open Log Allowed Traffic, and select either Security Events or All Sessions.
- Go to Log & Report > Log Settings.
- Open Send Logs to FortiAnalyzer/FortiManager.
- Set the FortiCASB receiver's IP address for IP Address.
- Login to the FortiGate's CLI mode.
- Configure log settings for the second FortiAnalyzer device on the FortiGate.
- Configure the log filter to only forward application-ctrl logs:
- Test the connection using the following CLI command:

FortiGate 5.6

FortiGate 5.4


NOTE: For FortiGate 5.4, set CASI to the default.

Log configuration using FortiGate GUI
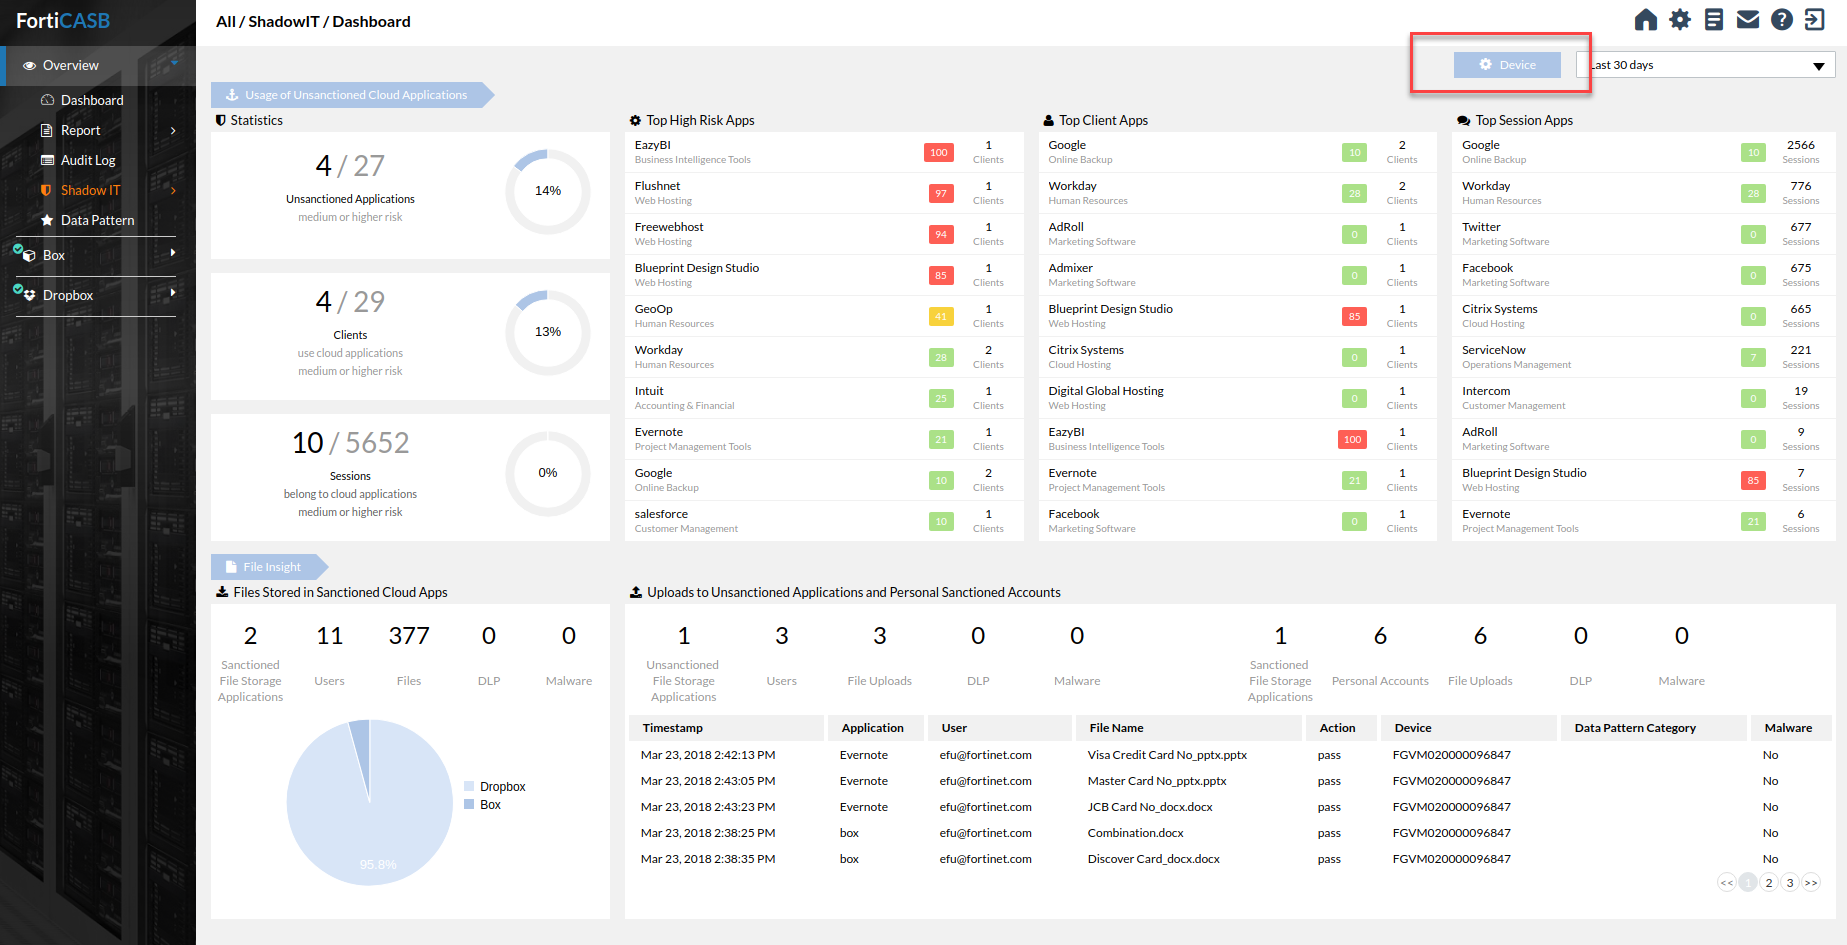
The FortiCASB receiver IP address can be found by pressing the Device button from the FortiCASB Shadow IT dashboard. It will be one of the followin addresses:
| Global Users | 34.212.87.235 or 52.27.136.156 |
| EU Users | 34.254.217.50 or 52.18.7.98 |
Enter the IP address into the appropriate section of the FortiGate UI, shown below, then click Test Connectivity.

Log configuration using FortiGate CLI
#config log fortianalyzer2 setting
#set status enable
#set server <FortiCASB server IP>
#set enc-algorithm high-medium
#set upload-option realtime
#set reliable enable
#end
#config log fortianalyzer2 filter
#set filter-type include
#set filter "logid(1059028704)"
#end
#execute log fortianalyzer test-connectivity 2
If the connection is successful, the FortiGate will return the following:
Registration: registered
Connection: allow
Otherwise, the FortiGate will return an error code.
FortiAnalyzer configuration
- Provide a public IPv4 address to your FortiAnalyzer. Make sure this IP address with the appropriate TCP port(default 443) can be accessed from the external network, via the internet.
- Finish steps 1-12 of the FortiGate configuration.
- Use the following commands to add RPC-permit's read and write permissions to the user:
- config system admin user
- edit admin
- set rpc-permit read-write
FortiCASB configuration
- Choose the device type to connect.
- Click the Device button, located on the top right, from the Shadow IT dashboard.
- Choose either FortiGate or FortiAnalyzer.
- Enter the device DevID.
- If the DevID is for FortiGate, fill in the other fields.
- If the DevID is for FortiAnalyzer, fill in the other fields, then select the FortiGate device(s) to add.
Using Shadow IT discovery
Access control
After analyzing an application using FortiCASB, users can use FortiGate's Web Filter to block or monitor the application.
- Use FortiCASB to get the host name of the traffic to be controlled.
- On the FortiGate device, go to Security Profile > Web Filter.
- Under Static URL Filter, choose the URL filter.
- Click Create to add a new URL filter.
- Choose a Type.
- Choose an Action.
- Set Status to Open.
- Click OK.

Shadow IT Dashboard
Usage of unsanctioned cloud applications
All unsanctioned cloud applications are given a ranking based on the risk score, the number of users, and volume of use. FortiCASB uses that data to pinpoint and display the applications, clients, and sessions that are most at risk. FortiCASB also displays the percentage of risky applications, clients, and sessions using pie charts.
File insight
File insight shows the total number of sanctioned cloud applications the organization is using, the total number of users, and the total number of files stored in each cloud application.
Application list
The application list displays all appliations monitored by FortiCASB. Filter the list using the time range box on the top right, the risk score slider on the top left, and the categories checkboxes on the left.
Click a specific application to display detailed information regarding the application.