


Traffic shaping charts 7.2.1
The Traffic Shaping Monitor dashboard is added to FortiView > Monitors.
This dashboard includes the following widgets:
- Bandwidth: Displays the bandwidth of traffic shapers over time in a line chart.
- Top Applications and Traffic Shaping: Displays the traffic volume and dropped bytes for the top applications in a stacked bar chart.
- Dropped Bytes Over Time Per Shaper: Displays the dropped bytes for different traffic shapers on a selected interface over a period of time in a line chart.
|
|
To use the Traffic Shaping Monitor, you must configure per-IP traffic shaper and shared traffic shaper on the FortiGate device. Then, configure a traffic shaping policy. For more information, see the FortiGate Administration Guide. |
To use these widgets, go to FortiView > Monitors > Traffic Shaping Monitor.

From the toolbar, select the devices, the traffic shaping interface, and a time range for the monitor. In the image below, the user selects wan1 (FGT91E-3) as the traffic shaping interface.

To use the Bandwidth widget:
- To display the bandwidth at a specific time in a tooltip, mouse over the line chart.

You can also click the bandwidth icon in the legend to hide/show the corresponding line in the chart.
To use the Top Applications and Traffic Shaping widget:
- From the Top dropdown, select the number of top applications (5/10/15/20) to display in the widget .
The widget displays the top five applications by default.
- To display a summary of application traffic and dropped bytes in a tooltip, mouse over the stacked bar chart.

Application Traffic and Dropped Bytes can be hidden/shown in the bar chart by click the corresponding icon in the legend.
- To display the Application Users table view, click a bar in the chart.
This view includes a summary of the application traffic, including the number of sessions and bytes (sent/received) by user.

- To return to the widget, click Top Applications and Traffic Shaping.
To use the Dropped Bytes Over Time Per Shaper widget:
- To display a summary of dropped bytes per shaper in a tooltip, mouse over the line chart.

- Click a shaper in the legend to hide/show it in the line chart.
Greyed-out shapers in the legend are hidden in the line chart.
- Click More details to display the Traffic Shaping Policy Hits table view.
This table includes the total sessions and bytes (sent/received) by shaping policy.
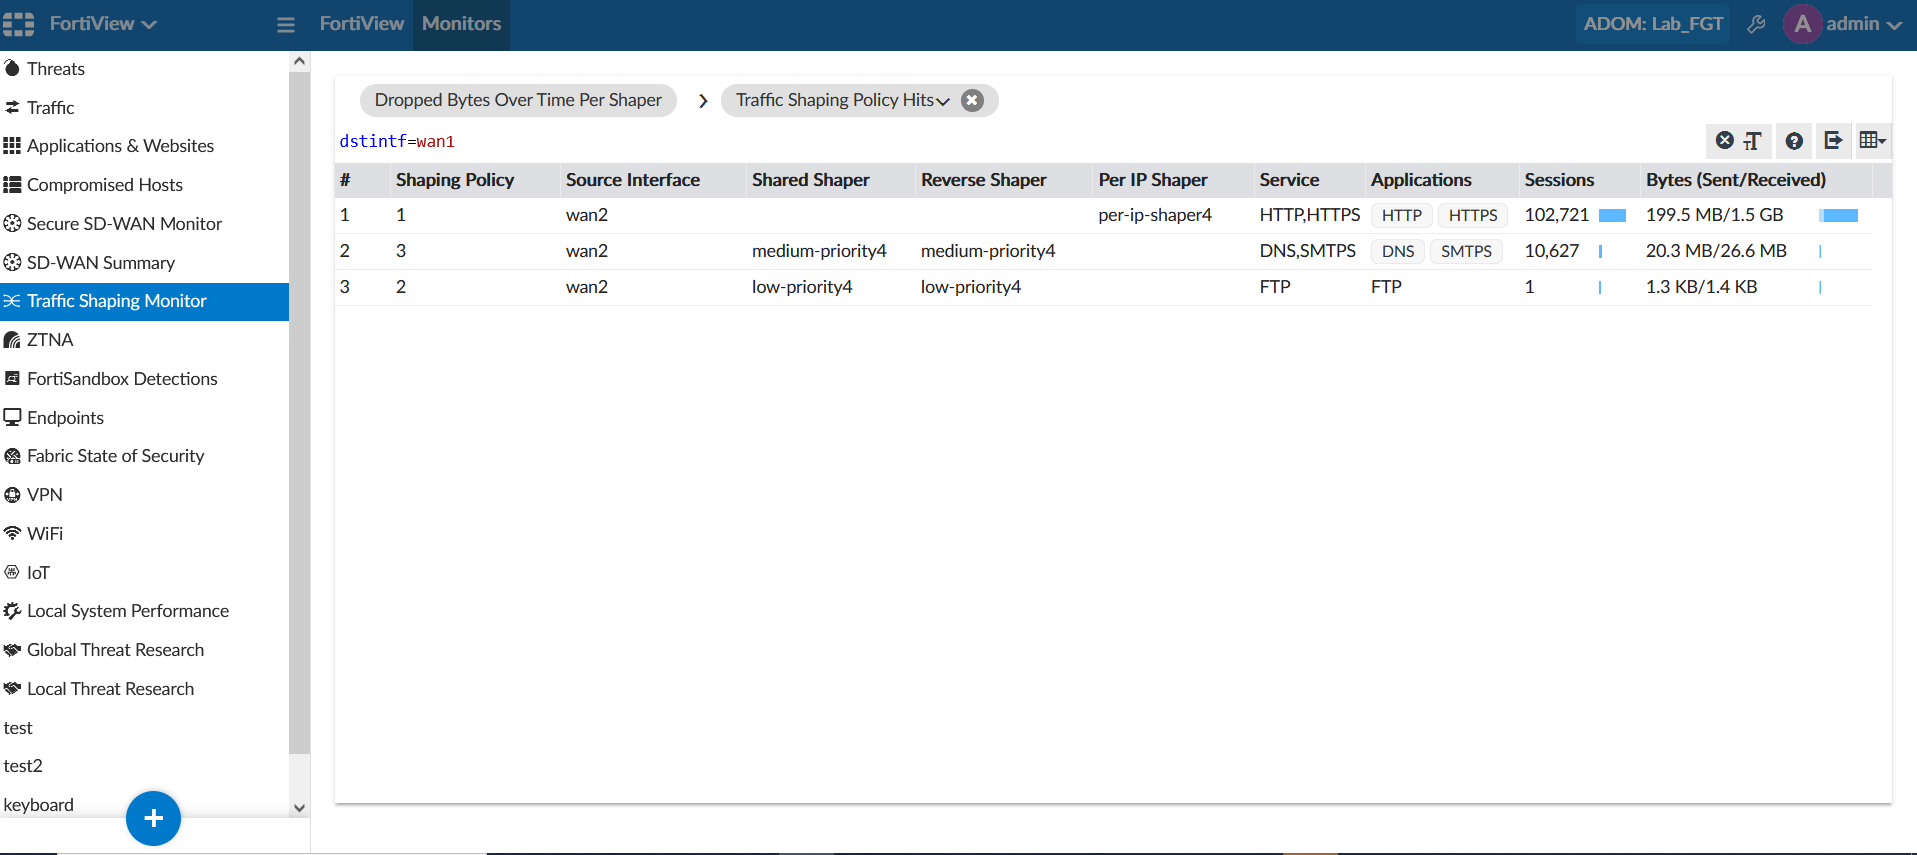
- To return to the chart, click Dropped Bytes Over Time Per Shaper.
Note that shared shapers, reverse shapers, and per-ip shapers are supported in this widget.