


Logging FortiGate traffic and using FortiView
In this example, you will configure logging to record information about sessions processed by your FortiGate. You will then use FortiView to look at the traffic logs and see how your network is being used.
FortiView is a logging tool made up of a number of dashboards that show real time and historical logs. The dashboards can be filtered to show specific results, and many of them also allow you to drill down for more information about a particular session. Each dashboard focuses on a different aspect of your network traffic, such as traffic sources of WiFi clients.
Some FortiView dashboards, such as Applications and Web Sites, require security profiles to be applied to traffic before they can display any results.

1. Configuring log settings
Go to Log & Report > Log Settings.
Select where log messages will be recorded. In this example, Local Log is used, because it is required by FortiView. Local logging is not supported on all FortiGate models. If your FortiGate does not support local logging, it is recommended to use FortiCloud.
Enable Disk, Local Reports, and Historical FortiView.

You can also use Remote Logging and Archiving to send logs to either a FortiAnalyzer/FortiManager, FortiCloud, or a Syslog server.
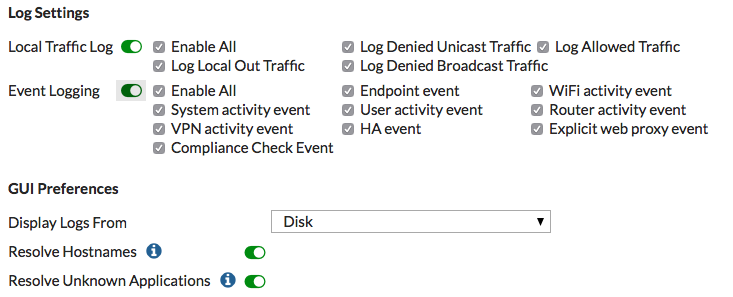
Under Log Settings, enable both Local Traffic Log and Event Logging.
You can choose to Enable All logging or only specific types, depending on how much network data you want to collect.
Under the GUI Preferences, set Display Logs From to the same location where the log messages are recorded (in the example, Disk).
2. Enabling logging in security policies
Go to Policy & Objects > IPv4 Policy. Edit the policies controlling the traffic you wish to log.
Under Logging Options, select All Sessions.

In most cases, it is recommended to select security events, as all sessions requires more system resources and storage space. For now, however, all sessions will be used to verify that logging has been set up successfully.
3. Results
Generate network traffic through the FortiGate, then go to FortiView > All Sessions and select the now view. A real time display of active sessions is shown. Historical views are only available on FortiGate models with internal hard drives.
If you right-click on a listed session, you can choose to remove that session, remove all sessions, or quarantine the source address of that session.

Select the 24 hours view. A historical view of your traffic is shown. If you select a session, more information about it is shown below.

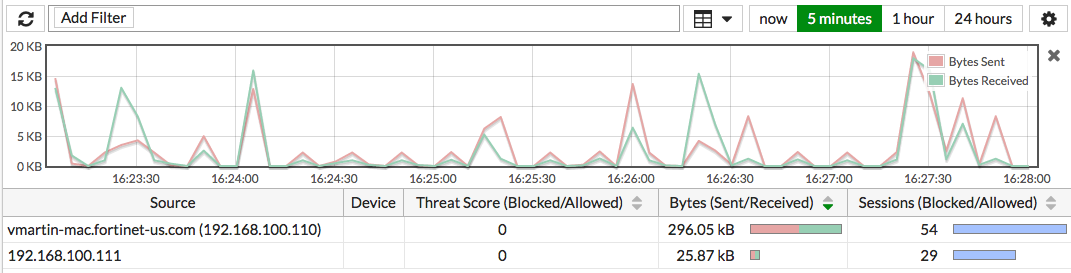
Go to FortiView > Sources and select the 5 minutes view. A list of the sources of your network traffic is shown, as well as a graph showing their activity during the last five minutes.
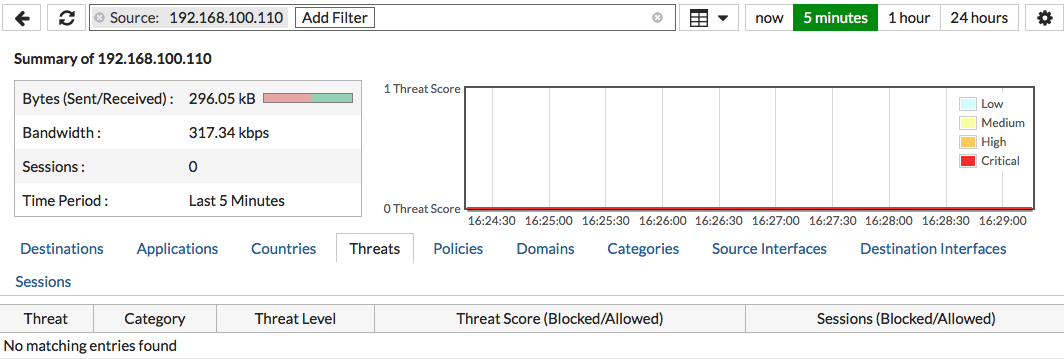
Right-click on any of the sources listed and select Drill Down to Details.
You can view a variety of information about the source address, including traffic destinations, security policies used, and if any threats are linked to traffic from this address.


For further reading, check out FortiView in the FortiOS 5.4 Handbook.
